2 Tales Of Clarity Using Google Analytics’ Multi-Channel Funnel Reporting
Are you making use of Multi-Channel Funnel (MCF) reports in Google Analytics? Columnist Carrie Albright offers ways to glean insights from one report in particular: Top Conversion Path.
[blockquote cite=”Former CEO of Hewlett-Packard Carly Fiorina”]The goal is to turn data into information, and information into insight.[/blockquote]
Few marketers dispute the wisdom of Carly Fiorina’s quote above — but when it comes to transforming data into valuable insights, the question is often where to look to find this data.
Analytics platforms offer entire worlds of detail for our interpretation, and in one corner of the Google Analytics universe that’s well worth exploring, you’ll find the Multi-Channel Funnel (MCF) reports.
The MCF tab of Google Analytics strictly represents those sessions that have ultimately resulted in a conversion, which means that your insights will solely be based off converted traffic.
Chapters could be authored on the uses of the Assisted Conversions, Time Lag, and Path Length reports, but this article focuses on the application of your Top Conversion Path report, my favorite of the MCF reports.
About The Top Conversion Paths Report
This report is hands down one of my most treasured possessions when it comes to evaluating the multi-channel pathways of your users. The visibility of a converter’s path contributes quantifiable value to your discussions with clients or in-house higher-ups as you highlight the impact of your marketing touch points.
Your Top Conversion Path (TCP) report can include any of the conversion goals being tracked in Google Analytics. An e-commerce business, for example, may be tracking sales as well as micro conversions such as “Find A Location” users and e-mail sign-ups. When it comes to using the Top Conversion Path report, it may be most valuable to segment these reports, looking just at online sales or a specific micro conversion for a period of time.
You can also set the period of time, called the lookback window, in which these interactions occurred. The default is 30 days from first click to conversion, but depending on the impact you’re striving for with your marketing efforts, the time period may be shorter or longer, and that can actually be reflected in this report.
Extra Tip: The Time-Lag report can be a hidden gem when establishing your best cookie window. This report reveals the specific visit in which your visitors are actually converting, and provide you with insights for how to set the best cookie length for your customers.
Using The Top Conversion Path Report To Glean Insights
Enough talk. At this point, you’re probably wondering, “How do I create and ultimately use the report?”
In creating a TCP report, one of the easiest ways to identify insights is by incorporating your campaign data. When the secondary dimension is set as “Campaign Path,” The report that you can then download will be chock full of PPC takeaways.
Practitioner’s Wisdom: This is one of many examples in which your campaign nomenclature can make everything so much easier. In this instance, all PPC campaigns are created reflecting their role in the account, such as “Branded | Exact” — or, as you’ll see below, “Shopping | Sperry.” This structure allows for very simple filtering so that the data generated in our report all contain a “Non-branded | _______” campaign.
Two Real Applications Of MCF Reports
Tale 1: A Tale Of The Underdogs
The first example comes from a situation where we heavily suspected that purchases made through branded or direct clicks may have originated with non-branded searches. As a good (read: data obsessed and somewhat neurotic) PPC manager, it was clear to me that we needed more than a “hunch” to validate this theory.
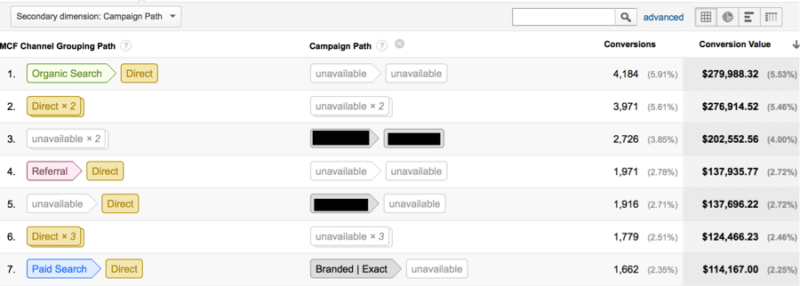
The report that followed highlighted how frequently a non-branded (general) or third party branded (product brand) ad impacted the long-term conversion process. To begin, we can generate an Assisted Conversions report with the Campaign Path included and focused strictly on conversions that occurred with these non-branded campaigns.

This is step one in identifying the campaigns that are playing the largest part in our sales, be it through Last (or Direct) Click or simply an assisted conversion.
The next step in this process was to show how our non-branded efforts are impacting customer acquisition, not just overall sales.
To do this, we pull the non-branded PPC-initiated Top Conversion Path report, including the campaign details, and export this beauty. In Excel, we identify the conversions that 1) began with a non-branded search, and 2) contained a direct search.
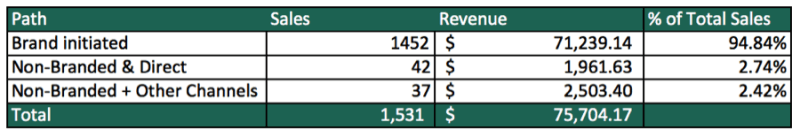
The brand-initiated searches are those in which visitors only interacted with branded searches, direct visits, and referrals through email campaigns. The remaining traffic originated through non-branded searches, but eventually came to the site through a branded source. From this date range, we infer that the visitor first came to our site based on interest in a specific product, but returned again because of interest in what the site has to offer.
Those non-branded campaigns that appeared in this report continued to receive a portion of our monthly budgets with an emphasis on those that created direct traffic; those that failed to contribute to total sales were our opportunities for reducing inefficiencies.
Tale 2: A Tale Of The Stolen Credit
In this story, the client was concerned that their non-branded campaigns were losing credit for sales, as they may have been misattributed to branded ads in their reporting platform.
Q: How many sales are initiated through non-branded searches that end in branded purchases?
A: 18% of total sales for this time period.
Simple, right?
But how did we demonstrate this clearly and concisely?
We began this analysis by examining the data in which the initial click and final sale both came from a PPC campaign. From here, the data was segmented into the categories based on the following questions:
- Did the initial click come from branded or non-branded searches?
- Did the final sale come from branded or non-branded PPC?
- Were other marketing channels present in the path to conversion?
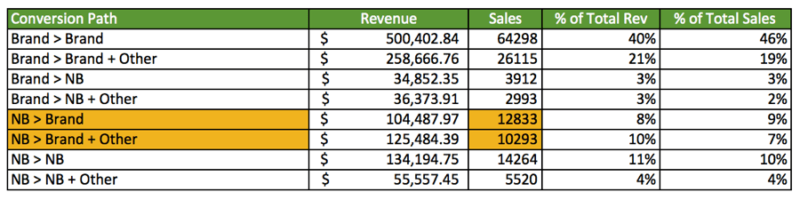
From this list, a pivot table was created that breaks down the data into these characteristics, with the golden cells pinpointing the sales originating with a non-branded clicks and ending with a purchase through a branded click.
This data is now prepared for comparison to back-end performance. For this timeframe, approximately 18% of sales initiated with non-branded but closed with brand, 15% of sales were strictly non-branded, and 67% of sales began with a branded search.
The Magical World Of Multi-Channel Funnel Reports
These two reports are simply stepping stones into the deep dive available through Multi-Channel Funnels and the attribution modeling available in Google Analytics. Once you’ve identified the channels that have the strongest impact, you can optimize your investment based on these insights.
For those of you focusing on multiple marketing channels, these reports are just a scratch in the surface of what you might find. While this article focuses on segments of PPC traffic, another obvious direction loops in your other marketing channels. How does your revenue change when visitors are both email referrals and direct visitors? Do display buys assist in customer acquisition, such as email list signups?
These relationships can be parsed out through your Analytics data and through the reporting found within your Multi-Channel Funnel tab. There is an eternity of insights awaiting you, it’s simply your task to begin gathering your data and assessing what it’s telling you. For as Sir Arthur Conan Doyle said:
[blockquote]Data! Data! Data! I can’t make bricks without clay![/blockquote]
Opinions expressed in this article are those of the guest author and not necessarily Search Engine Land. Staff authors are listed here.
Related stories
About the author