Do It Yourself A/B Testing
I always start marketing interviews with a phone screen of some variant of the following question: “Let’s say this is your first day at Urbanspoon and I show you the following data. We’ve just launched an A/B test of that I’d like you to evaluate. [The example can be almost anything you want to test […]
I always start marketing interviews with a phone screen of some variant of the following question:
“Let’s say this is your first day at Urbanspoon and I show you the following data. We’ve just launched an A/B test of that I’d like you to evaluate. [The example can be almost anything you want to test different results for – from almost any search element, PPC campaigns, email subject lines etc. In this case, I’m using a PPC example.] Imagine you are running two different ads on a campaign with 50 kewords. We’ve been running Ad A for a while and have 17,235 impressions and 272 clicks. I started running Ad B last week and that has received 41 clicks on 2,253 impressions. What would you do?”
I’m looking for an answer that goes beyond demonstration of pre-algebra skills and rudimentary familiarity with a calculator.
Obvious answers include splitting up 50 keywords into different groups, looking down stream to see differences in conversion rates, and technical answers around quality score. But what I’m really looking for is a theoretical understanding of statistics and the interplay between sample sizes, variability and confidence intervals.
Answers to the above theoretical question usually fall into one of three buckets:
- I’d run as more Ad B’s so our impressions are equal and then compare the click through rates. #FAIL
- I’d run the Ads longer, you need at least 3 weeks of data to make a decision. #FAIL
- Ad B is better b/c the click through rate is higher. #FAIL “and thanks for taking the time to talk with me, our HR department will be in touch . . .”
Turns out, you don’t need to have an equal number of impressions or a set amount of time to run this analysis. It’s actually a fairly simple concept that can ultimately then be mathematically defined:
The greater the difference between your A and B samples (drawn randomly from the same pool) the smaller the size your test needs to be in order to confidently assert that one performs better than another. Example – if we wanted to test if men were taller than women and we measured 100 men and 100 women and the men averaged 7 feet tall and the women averaged 4 feet tall, you’d be fairly confident saying that men are taller than women.
Conversely, if the difference was 3 inches instead of 3 feet, you’d probably want to measure more men and women before confidently asserting men are taller than women.
In fact, it’s possible that your sample was misleading – as a population women are really taller than men, but your sample didn’t bear that out. This level of confidence can be mathematically expressed as a percentage – I’m 95% certain that A is better than B. (Meaning there is a 5% chance, or 1 out of every 20 times where you’ll unwittingly pick the underperformer.) The greater the level of confidence you want, the larger the sample size you need.
All of this can be calculated with innumerable free online tools. Larger sophisticated systems like Adwords and big ESPs build this statistical testing in to their testing methodology – but it’s easy for do-it-yourselfers too.
I like a tool called AB Tester, which allows you to measure up to three alternatives compared to a benchmark:

In the results above, I’ve done the analysis for our question . . . The “Confidence” column tells me there’s a 79.19% chance that B is better than our control A.
Watch how this Confidence grows when we add a zero to each column – keeping the CTR the same but increasing the sample size:
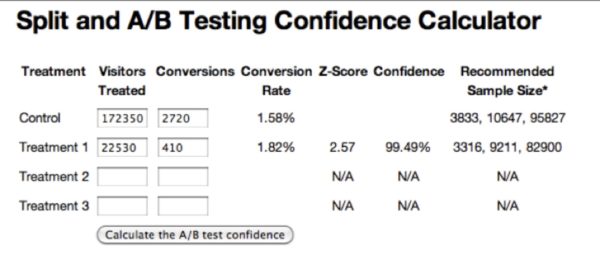
By increasing the size of the test tenfold, now there’s only 0.5% that A is really better than B.
Let’s go from theoretical to real. Here are results from an email test we did for our Hawaiian getaway promotion to Ludobites 9. (It’s over now, sorry.)
The first data column is sends, then delivered, then opens, then clicks. Assume we want to test three different content types to three different cities (now admittedly this is not a random sample – maybe people in San Francisco respond differently to content . . . )

Take the data from the 3/6 send and plug it in to A/B Tester. Note I’m comparing the CTR from Opened emails to isolate content as an impact to click through rate. Also note that while the sample sizes are similar, they don’t have to be the same.
My best performer here is the San Francisco content at a 5.5% CTR. I use that as a control and plug the other two into AB Tester:

This tells me there’s a 3.3% likelihood that the LA content might really outperform the winner (San Francisco). Additionally, there’s a 23.5% chance Seattle content is better than our “winner”. More testing necessary . . . .
Opinions expressed in this article are those of the guest author and not necessarily Search Engine Land. Staff authors are listed here.
Related stories
New on Search Engine Land
About the author