Five Reports For Measuring B2B Marketing Effectiveness
Like many online marketing professionals, B2B marketers are obsessed with data. Technological innovation creates phenomenal opportunities for marketers to “slice and dice” information in an effort to create more meaningful lead acquisition strategies. But, innovation might also act as a deterrent and be considerably overwhelming. A recent article on MarketingSherpa discussed their latest survey report […]
Like many online marketing professionals, B2B marketers are obsessed with data. Technological innovation creates phenomenal opportunities for marketers to “slice and dice” information in an effort to create more meaningful lead acquisition strategies. But, innovation might also act as a deterrent and be considerably overwhelming.
A recent article on MarketingSherpa discussed their latest survey report on marketing analytics, which indicates that 42% of marketers surveyed believe the ability to act on data to be the most significant challenge they face. Combining data from multiple sources and simply finding budget to acquire new resources ranked second and third, respectively.

B2B marketers have trouble absorbing the data that they actually have access to, making it difficult to create an informed and effective strategy from the data received. Further, this makes it difficult to validate initiatives to upper management and key decision makers. A recent survey of 1,200 CEO’s indicated that nearly 70% have lost trust in their marketers’ ability to deliver growth, in part because of the inability to show ROI on campaigns.
While I personally like to dig pretty deep to evaluate and understand changes in site performance, there are a number of much higher-level reports and dashboards that can provide any B2B marketer with actionable insights. From basic to more advanced, here are five key reports to look at for marketing analytics performance benchmarking.
Note that I am using Google Analytics (GA) information for example and screen grab purposes; but, similar information can be found in other reporting tools like Site Catalyst and Webtrends. The paths to the information are obviously different.
1. Year-Over-Year Comparison Reports
GA Location: Traffic Sources –> Sources –> Search –> Organic
Regardless of the report type, I almost always recommend using period-to-period comparisons. This will typically mean year-over-year comparisons, but that can change depending on business type and objectives. The year-over-year organic search report gives a high-level view of whether or not SEO initiatives are generating results and improvements.
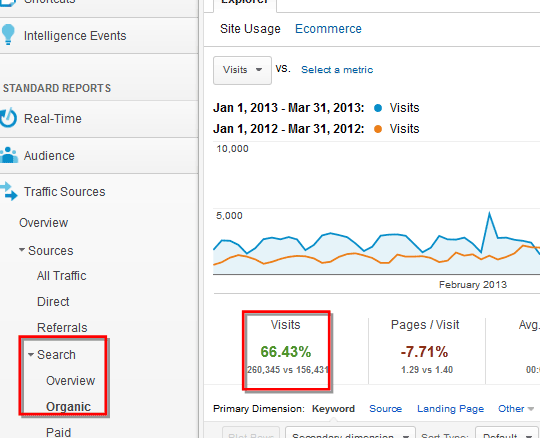
You will notice that above the date range, it is possible (and recommended) to change the view of this report to include e-commerce or conversion metrics (goals) as well as site usage, which is the default view.
2. Period-To-Period Traffic By Channel Reports
GA Location: Traffic Sources –> Sources –> All Traffic (by Source / Medium, Source, Medium, etc.)
Why such a high-level report? Because once the B2B marketer understands the performance of a single channel (like organic search), he or she can compare it to and evaluate it against all other channels.
Is a 1% conversion rate in organic search good or bad? The key is knowing how that 1% compares to direct traffic, third-party referrals, and paid search.

3. Key Traffic Percentage Breakdown By Medium
GA Location: Traffic Sources –> Overview
Google’s Avinash Kaushik recommends that a balanced portfolio of traffic sources would look somewhere in the range of 40 – 50% search, 20% referral traffic, 20% direct, and 10% campaign traffic (display, email, etc.).
B2B marketers need to periodically review their traffic balance to determine what areas of digital marketing are getting stronger or weaker.
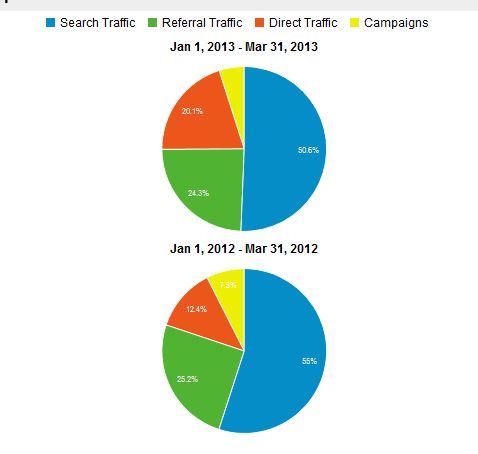
This report, coupled with the traffic performance by channel report, provides solid insight on which digital marketing channels are strongest and which are in need of improvement.
4. Period-To-Period Page Performance
GA Location: Content –> Site Content –> All Pages (Include “Page” containing — or excluding — various Web address variables)
Period-by-period page performance reporting — by section, type, individual page, etc. — can help show the impact of the assets created for building organic search visibility. With content becoming such an important component of every B2B marketer’s strategy, this report is essential in demonstrating content performance.

5. Performance of “Not Provided” Search Traffic
GA Location: Traffic Sources –> Sources –> Search –> Organic –> “Not Provided” (filter by “Landing Page” as a secondary dimension)
Finally, for evaluating the impact of “not provided” referrals, we track the applicable individual landing page performance. This report gives a sense of what content logged-in searchers are landing on.

B2B SEO professionals in particular should use this report to demonstrate the additional impact that their content assets have as it pertains to “not provided” search referral information.
The Next Step: Custom Dashboards
Once you’re active enough in marketing analytics, the need for a few custom dashboards might make sense. The value of custom dashboards is that they aggregate a mix of (potentially) important information on a single screen, saving time in switching between report types or browser screens to make comparisons.
Here are four custom Google Analytics dashboards I recommend:
Anna Lewis of Koozai put together a great list of custom dashboards in her presentation at BrightonSEO last fall:
- SEO Dashboard — This dashboard does a great job of providing a comprehensive overview of useful SEO metrics such as total organic visits and total non-branded organic visits, as well as keyword and landing page-level statistics such as visits, bounce rate and conversions. It is also very easy to customized once integrated. Click here to get the SEO Dashboard.
- Brand Engagement Dashboard — This dashboard provides a bird’s eye view of brand engagement metrics, focusing specifically on users who visited the site as a result of brand awareness and brand-building marketing efforts (branded organic search queries, social media visits, etc.). This dashboard is useful for B2B marketers who must illustrate the importance of brand development and the impact it can have on conversions and goals. Click here to get the Brand Engagement Dashboard.
Justin Cutroni’s social media dashboard is a little bit more complex, but provides a comprehensive way for marketers to help demonstrate the value of their social media programs. His blog post provides a great overview of the dashboard and each widget that powers it. Click here to get the Social Media Dashboard.
Finally, Michael Wiegand of Portent put together a very simple but effective “Perfect” Dashboard that provides top level data associated with leads (or revenue), traffic / traffic sources, and landing pages. It’s becoming one of the first places I go in Google Analytics, and it is very easy to customize to preference (yours or your clients). He created two versions — one for e-commerce sites and one for lead generation sites:
- Click here to get the “Perfect” Dashboard for e-commerce sites
- Click here to get the “Perfect” Dashboard for lead generation sites
Need more?
Google Analytics has a simple-to-use directory for marketers interested in exploring even more custom dashboards, filters, and reports. This solutions gallery allows you to search by business objective, marketing function, and/or analytics type.
Jill Whalen also created a forum, Custom Report Sharing, to share, collaborate, and discuss more advanced reporting functions in Google Analytics, specifically.
Final Thoughts & Considerations
At the end of the day, it is not necessarily how much data marketers have, but how effective they are at gleaning actionable insights from that data. What reporting functionality is essential in your B2B marketing mix? I would love to read your feedback and perspective via comments below.
Opinions expressed in this article are those of the guest author and not necessarily Search Engine Land. Staff authors are listed here.
Related stories
New on Search Engine Land
About the author