How To Estimate Incremental Revenue Opportunities With Impression Share Data
When looking for opportunities for growth, most search marketers try to find ways to estimate how much they can scale up their paid search effort, and what would be the impact on ad spend, revenue volume, and efficiency. There are lots of different ways to go about this – one way I’d like to cover […]
When looking for opportunities for growth, most search marketers try to find ways to estimate how much they can scale up their paid search effort, and what would be the impact on ad spend, revenue volume, and efficiency.
There are lots of different ways to go about this – one way I’d like to cover in this post is to leverage impression share data. We’ll see how to aggregate and dig into impression share data, and how to estimate incremental revenue opportunities based on those impressions missed due to insufficient budget. Due to the length of this post, I thought I’d cover those impressions missed due to insufficient rank in a separate article.
Note that a similar logic can be applied to AdWords impression share data and Bing Ads share of voice data.
Getting A High-Level View Of Your Impression Share In Paid Search
Impression share data is currently available at the campaign/ad group levels in AdWords, and account/campaign/ad group/keyword levels in Bing Ads. Whatever level you are interested in, the same logic can be applied to aggregate impression share data up to the account level or any label/dimension you like.
The metrics I will refer to in this post will be:
- AdWords Search impression share/Bing Ads impression share (%) = IS
- AdWords Search Lost (budget)/Bing Ads Impression share lost to budget (%) = Lost IS (Budget)
- AdWords Search Lost IS (rank)/Bing Ads Impression share lost to rank (%) = Lost IS (Rank)
Say we want to analyze the below campaigns in AdWords – and we want to determine what is the combined impression share. We need to aggregate the impression share data by weighting the IS data by the number of impressions of each individual campaign.
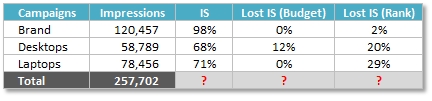
More specifically, the aggregated IS in this example is: (120,457*98% +58,789*68% +78,456*71%) /(120,457 +58,789 +78,456) =83%
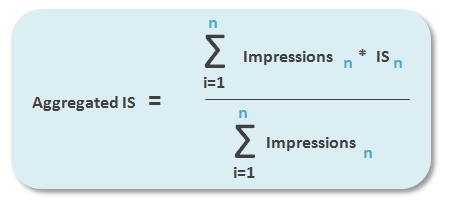
Generally speaking, if n indicates individual campaigns (or ad groups), the formula to determine the aggregated IS is:
The same thought process can be applied to the aggregated Lost IS (budget). The aggregated Lost IS (budget) is then (120,457*0% +58,789*68% +78,456*71%) /(120,457 +58,789 +78,456) =2.7%
Hence, a similar formula to determine aggregated Lost IS (budget).
Same thing for the Lost IS (rank). The aggregated Lost IS (rank) is then (120,457*2% +58,789*20% +78,456*29%) /(120,457 +58,789 +78,456) =14%
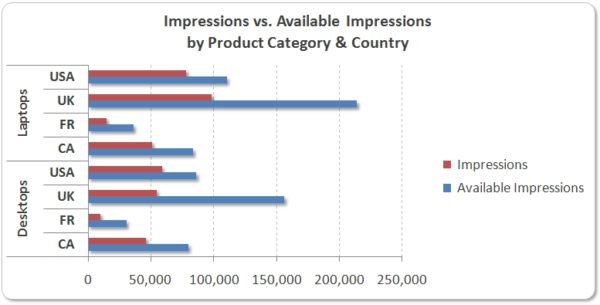
Now that we can aggregate IS data, we can visualize the data at different levels — for example, by country and by product category/country:


Determining The Room For Growth
One can easily determine the total number of available impressions in the marketplace if you were not missing any impressions due to neither insufficient budget nor rank. This provides some hard numbers as of the actual room for growth.
For instance, if your IS was 68% and you got 58,789 impressions, then the number of available impressions in the marketplace was 58,789 /68% =86,454.
You can generalize the calculation to determine available impressions — for instance, by country and product:
Estimating Incremental Revenue Opportunities Based Off Lost IS (Budget)
As for those campaigns capped due budget, the logic is relatively simple. Assuming you are not changing your bids/creatives/landing pages in the meantime, one can expect stable CTR, CPC, conversion rate, and average order value (AOV) for those incremental impressions:
- Incremental Impressions (Budget) =Available Impressions * Lost IS (budget)
- Incremental Clicks (Budget) =Incremental Impressions (Budget) *Stable CTR
- Incremental Cost (Budget)= Incremental Clicks (Budget) *Stable CPC
- Incremental Conversions (Budget) = Incremental Clicks *Stable Conversion Rate
- Incremental Revenue (Budget) =Incremental Conversions *Stable AOV
Getting back to my initial example, if a campaign generated 58,789 impressions and had a IS of 68% and a Lost IS (budget) of 12%, then the total number of available impressions is 86,454, and the corresponding number of incremental impressions due to budget is 12%*58,789 =10,375. This particular campaign would generate an additional 10,375 impressions if opening up the daily budget.
Assuming the CTR and CPC are stable on those incremental impressions, then the number of incremental clicks due to budget for this campaign would be 10,375*3.4% =353. This campaign would generate an additional 353 clicks.
Assuming the conversion rate is stable on those incremental clicks, then the number of incremental conversions due to budget would be 353*2.1% =7 (after rounding this value). We can also assume the AOV is stable at $612 and come up with hard incremental revenue numbers.
At a high level, you can use the same methodology across all campaigns, aggregate the data, and come up with incremental conversion estimates by country or any dimension you are interested in.
Also, beyond the raw potential for conversion growth or revenue wise, search marketers typically look for the most efficient growth possible, which one can determine by looking at the incremental ROAS for this incremental revenue.
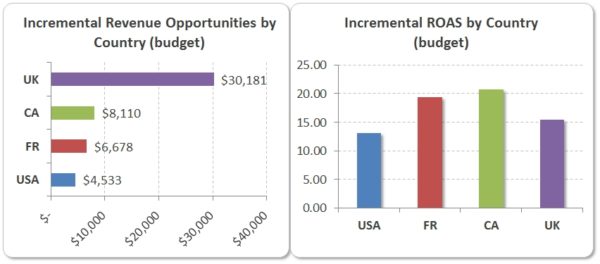
This is a first step to impression share analysis and potential budget reallocation. In the above example, the UK market seems to have lots of potential in terms of revenue volume, however the CA and FR markets seem more profitable, so you might want to invest more there first.
Again, since the same methodology can be applied at the country, product category, brand vs. non-brand levels, or any dimension you’re interested in – this analysis can help go beyond traditional paid search and make better business decisions based off not only current performance but also future growth.
Opinions expressed in this article are those of the guest author and not necessarily Search Engine Land. Staff authors are listed here.
Related stories
New on Search Engine Land
About the author