How To Use Day Parting In Google Analytics To Optimize Your Budget
All too often, there are still companies who set their daily budget on their Adwords campaigns that is not sufficient in comparison to the available search volume. This will cause lost impression share. If your campaigns are performing according to the KPIs you have set, the budget should not be a factor. With the day […]
All too often, there are still companies who set their daily budget on their Adwords campaigns that is not sufficient in comparison to the available search volume. This will cause lost impression share. If your campaigns are performing according to the KPIs you have set, the budget should not be a factor.
With the day parts option in Google Analytics, you can see the performance of your campaigns during the different hours of the day or days of the week.
For companies with a fixed daily budget, the day parts option can give you insight to increase or decrease bids on certain hours of the day to make optimal use of the limited available budget.
Every company should check out the day parts option to get an idea which hours or days of the week are performing the best. With this information, you can test by increasing or decreasing bids for certain hours or days of the week to improve your ROI.
First, I will explain where you can find the option of increasing and/or decreasing bids in Google Adwords. This is the option for ad scheduling. You can find this under the Settings tab of your campaign under advanced settings and then choose for the option:
Schedule: Start Date, End Date & Ad Scheduling
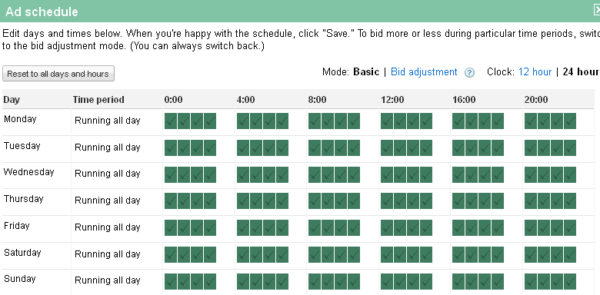
If you click on ‘edit’ next to ad scheduling, you will get a pop-up (see below screenshot). It will open in basic mode, but by clicking on bid adjustment, you can increase and/or decrease bids for certain hours or days.
By going to the Dimension tab of the campaign, you can filter on day of the week or hour of the day to see which days or hours are performing well according to the KPI’s you have set.
To get hours or day of the week information in Google Analytics, use the day parts option which you can find under Advertising > Adwords > Day Parts.
It provides you with some extra site performing metrics such as time on site, bounce rate and revenue. These metrics cannot be found using the option in Google Adwords.
Let’s look at a client’s Adwords campaign over a period of 3 months using the day parts option. Going to the day parts option, I can see the traffic graphed by hour. If I click on day of the week, the information is graphed by day from 0 (Sunday) till 6 (Saturday).
First, I exported the data to Excel for an overview of which hours are driving the most traffic, transactions and revenue. Choose the E-commerce tab before exporting, so you will get the revenue data. You will get an overview that looks like the image below:
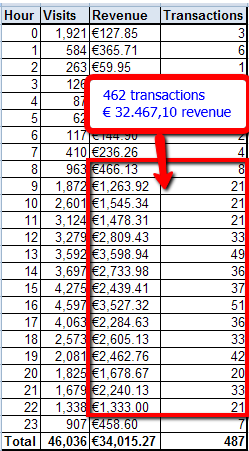
I looked at the hours in which most transactions and revenue were generated. You can see that 462 of the 487 transactions are made between 08:00 hrs and 23:00 hrs. This is 94,87%!
This may not be very shocking, because in this example you are only driving in total 4.477 visits (0 till 7 hour + 23) of a total of 46.036, so 9,72%. But if you pay, for example, €1 per click for these visits you pay in total €4.477.
For this amount, you are getting 25 transactions, so per transaction this is:
€ 179,08 (€4.477/25)
It is pretty expensive to invest €179,08 for 1 transaction. The average order value is € 60, so this is definitely not profitable. You can consider investing your money in the more profitable hours of the days to increase the ROI.
Of course, it is all about testing to find out if investing your money on certain hours of the day will lead to better results. But you won’t find out until you run the day parts report in Google Analytics.
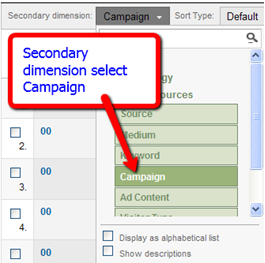
What is great from the day parts option in Google Analytics, is that you can drill all the way down to campaign level or even keyword level. For example, you want to know what your branding campaign is doing on certain hours of the day.
To get this information, just select Campaign through secondary dimension and you get all the campaign information each hour of the day. Click on the advanced option, so you can filter out your branding campaign.

You can do this for every campaign. For a client, I looked at the campaign with the highest costs and also the most conversions. This campaign is losing a lot of impressions due to lack of budget. If the budget is limited by a client, why not invest your money during the hours that are performing best?
For this particular client, 119 of total of 145 conversions happen between 10:00 – 19:00 hrs. The campaign settings in Adwords are: show ads all days and hours.
It’s worth testing to increase the bids between 10:00 – 19:00 hrs to increase visibility during the time most people convert. Maybe you can decrease bids during the other hours, because people are less likely to convert.
The day parts in Google Analytics is a great way to find out how your Adwords campaigns are performing during each hour of the day. It can give you some valuable insights which can make you decide to increase and/or decrease bids on certain hours or maybe stop advertising on certain hours to increase the ROI of your campaigns.
First test to see what are the results of your changes, before you carry them out definitively.
I am interested in hearing your experiences using the day parts option in Google Analytics, so please leave your comments.
Opinions expressed in this article are those of the guest author and not necessarily Search Engine Land. Staff authors are listed here.
Related stories
About the author