Justified – Beginning Steps To Proving Your Internet Marketing Point
If you’re working in online marketing in some function, you’ve battled this – the need to justify your marketing budget to the bean counters in the office 10 floors up, or even next door. Those not “in the know” about the truly trackable benefits of online marketing are generally skeptical at best when told “I […]
If you’re working in online marketing in some function, you’ve battled this – the need to justify your marketing budget to the bean counters in the office 10 floors up, or even next door.
Those not “in the know” about the truly trackable benefits of online marketing are generally skeptical at best when told “I can show you where every penny went, and what we got back in return.”
The inability to track return on radio, tv or even print ad buys without extensive (and frankly pretty difficult) work and integration between multiple departments makes these less than desireable mediums in my mind, but to someone who has used those outlets for 20 years or more, getting them to divert, or continue to divert, dollars into “this Internet thing” is not easy.
Here are some tips for those fairly new to using analytics on how to justify your job, and your budget. The snaps below are cobbled together and taken from a variety of clients, but the visuals have not been changed, so don’t read too much into the actual numbers. We’re showing this to give you an idea of how to find and read the data.
First, you MUST set up conversion tracking. If that conversion isn’t an online purchase, it has to be something else. Whether it’s a click-through to another site, or a form submission, there are ways to track how many of those you receive.
Check into this post on Event Tracking, or this one on Goal Tracking. If you don’t track dollars through your site, you might know what each form submission or newsletter sign up means to your company dollar-wise. You can set those goal values when you set up Goal Tracking, which will make the following reports easier to understand in terms of return on investment.
After your conversion tracking is set up, take a look at your Multi-Channel-Funnels reports. This is where a good amount of insight is going to come into how ad dollars move people into your conversion funnels.

Once you’re in the right spot, you’re going to see the relation between how someone finds your site, and when they purchase. You’re going to see a variety of paths here, most “buyers” visit a site multiple times, and get there via multiple paths.
Multi Channel Funnels – Top Conversion Paths – All Traffic
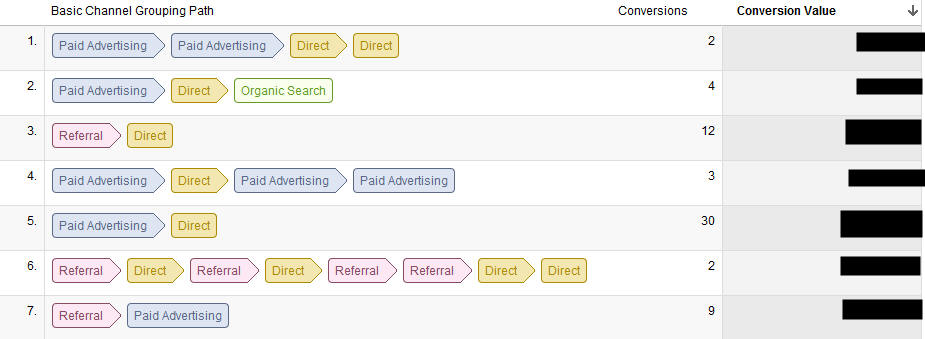
You can see above, that Referrals and Paid Advertising have a huge impact on conversions, where Direct access conversions are, in all cases, supported by a paid advertising or referral click.
When looking at this report – be sure you sort so you are looking at the top Conversions or Conversion Values first. The report defaults to sort by Conversion – but these conversions relate to goals not to purchases – so 30 goal conversions may equal $2658.70, but for this particular site (high dollar vacation travel), that’s only one purchase.
Multi Channel Funnels – Top Conversion Paths – AdWords
Running an adwords campaign, and justifying spend on top-dollar keywords is helped by scrolling to the top of your Top Conversion Paths report and clicking “AdWords” instead of “All.”

Now you’re going to add a secondary dimension within the report:

Once you’ve done this – you’re going to see which adgroups and keywords are leading to the most conversions, be those conversions “goals” or “dollars”

My one “gripe” about this report is the “unavailable” isn’t defined. I am guessing that this means there were some “non-Adwords” steps within the conversion path, and those aren’t shown or show as “unavailable”
This report is a big help when showing your c-suite how every aspect of search marketing works together to boost conversions.
Traffic Source E-commerce Report
Once your ecommerce tracking is set up – you can see what each referral means for your bottom line. Some online ad placements are expensive, and it’s important to see how those investments return money back to your business.
Here’s a report that will help you see return and justify your investment decisions.

Once you’re in the All Traffic Traffic Source report, click on the E-commerce tab:

Within this report – you’ll be able to sort by conversions and Revenue and see the referrers that send you dollars over any given period of time.
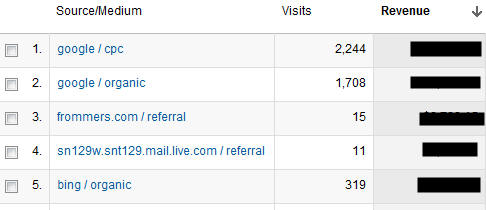
The data above would justify a few things in my mind. First, we make more money on PPC clicks than organic clicks, so we should keep our PPC budget, but work towards better organic rankings.
It also justifies the Ad placement on Frommers.com, and my email marketing blast sent at least $1949.91 in revenue. Generally – any “mail.” type of source is the result of someone emailing someone else a link, or your email marketing.
You can match this data with a “Campaign” report for your email marketing to double check that result.
Traffic Source Campaign Ecommerce Report
If you’re buying and placing ads, you should be able to dictate the landing page URL for each placement. Outside of Google Properties (AdWords, Express, etc) you need to set up Campaign tracking for each buy to be sure your spend is justified in return revenue.
Use the Google URL Builder to build a landing page URL that will automatically create a campaign for you to track in your analytics.
To see how campaigns work – once you’ve set up your URLs at your referring sites, click on Campaigns under Traffic Sources.

Then choose Ecommerce at the top of the page again.

Now you’re going to see all of your campaigns across Google and outside networks –and how much revenue they returned.

In this instance – some of the email marketing we did over the holidays had a nice return and is definitely justified
In the end, doing a lot of great work and achieving great visibility for your site might just not be enough. We’ve all had those bosses or clients who don’t understand bounce rates and average time on site, and only looked at dollar signs.
The reports above will help you prove the work you’re already doing is having a positive impact on the bottom line.
Opinions expressed in this article are those of the guest author and not necessarily Search Engine Land. Staff authors are listed here.
Related stories
New on Search Engine Land
About the author