The Minimum Quality Score That Can Save You Money In AdWords
How does your Quality Score affect your cost per click in AdWords? To find out, columnist Frederick Vallaeys explores the relationship between Quality Score and first page bid estimates.

I’m writing this on the plane on my way home from the Acquisio Summit in Montreal, where I gave a talk on the topic of Quality Score (QS).
My team and I had been working all week on a new analysis of how Quality Score affects cost per click (CPC) by analyzing correlations between first page bids (FPB) and QS so that we’d have something new and interesting to share. Our theory was that the two should be linked and that changes in FPB would give us insight into how much CPC is affected by moving from one level of QS to another. I think our findings were quite interesting, so I’ll share those here.
Google’s Quality Score Update
Google recently announced a change in the way that it reports keyword Quality Score in AdWords — effective immediately, all newly added keywords would receive a starting Quality Score of 6. In the past, the QS for a new keyword was set based on three factors:
- The historical click-through rate (CTR) performance of the keyword across the entire AdWords system.
- The account-level Quality Score.
- The historical performance of the visible URL.
By using these factors, the system could predict the Quality Score of a keyword for which it didn’t yet have enough specific performance data. Once it has this more specific data, it uses that, along with real-time relevancy factors, to predict the likely CTR for a keyword for any given search.
With this change, all advertisers will now see a Quality Score of 6 for a keyword that has no impressions in the account. Once impressions start to accrue, Google will quickly update the QS based on what they see. Because Google still has tons of data to help its machine learning algorithms predict the CTR, it shouldn’t take long for the QS to be updated. I believe that the advertiser’s historical performance (i.e., the account-level QS) will remain an important factor in that calculation.
(At Optmyzr, we did notice a larger than typical number of QS changes in the days leading up to the Google announcement, and we will share our findings in an upcoming post.)
How Frequently Is Quality Score Updated?
Keep in mind that while Quality Score is calculated in real time for every auction, the number we see in the AdWords interface is updated approximately once per day. The QS numbers are not updated for all keywords in an account at once; instead, it’s a rolling update. So one keyword in an ad group may be updated now, and another keyword in the exact same ad group may not see its QS number updated for several more hours.
In our Optmyzr Quality Score Tracker tool, we pull the latest QS numbers for keywords once per day, at approximately the same time for each account, to ensure that we’re not missing any changes. Keywords that get thousands of impressions per day may see their QS updated a lot more frequently in the AdWords interface.
How Frequently Are First Page Bid Estimates Updated?
For my presentation in Montreal, I wanted to quantify the impact of Quality Score on CPCs. I’ve written in the past about how QS figures into ad rank, and by extension how average CPC is affected by QS. The short version is that an increase in QS reduces the CPC required to maintain your ad rank vs. competitors.
To quantify the impact, we analyzed about 100,000 keywords in our own accounts that had a change in Quality Score on one day. We tracked both the old and new QS, as well as the old and new first page bid (FPB).
Our first finding of interest was that in about 70% of the cases where QS changed — regardless of the amount it changed and regardless of the starting or ending QS — the FPB remained the same. This surprised me. It indicates that FPB estimates are not updated at the same time as QS in the AdWords interface.
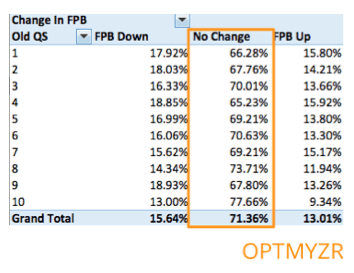
This table shows that the majority of keywords with a change in QS have no associated change in FPB. This happens at all levels of QS.
This finding is important because there are Google bid strategies that rely on these estimates. If the estimates are outdated, using them as part of a bid algorithm can cause inaccurate bids. For example, if QS has declined, your CPC to maintain your rank must go up (assuming no change in competition). However, if the first page bid estimate doesn’t reflect the new CPC requirement from a decline in QS, you are likely to underbid and lose impression share, at least for a few hours, until the FPB does get updated.
In my work with agencies like SalesX, we noticed that bid rules based on FPB estimates would often not perform well when we set bids to exactly the FPB estimate. In those cases, the ads would most often not even make it onto page 1 of the search results pages.
What Is The Average Quality Score In AdWords?
Advertisers are often curious about what Quality Score they should target so that they can confidently report to their boss or client that their account is “well managed.” In other words, what QS number is indicative of an account that’s at least average? While this was not something we were looking for in the data, we got an answer anyway.
However, rather than looking at the average across keywords or across accounts, we got our answer a slightly different way. Let me explain….
Most analyses of average Quality Score look at it from the advertiser’s perspective, but our answer came from looking at the data from the auction’s perspective. The risk of using account data to calculate average QS is that you’re usually looking at a skewed subset of accounts that are not representative of the entire AdWords system. This is because the terms of the Google API forbid anyone from publishing aggregate data, so you can’t use a huge data set.
Furthermore, when any tool company or agency does use some level of aggregate data, that tends to be skewed by the fact that their accounts are better managed than average. You may disagree with the premise that agencies and tools manage accounts better than average, but I hope you agree with the point that the data is biased and shouldn’t be used to come up with a system-wide average for QS.
In our analysis, we looked at the data from the perspective of the auction by trying to correlate the amount of change in FPB to changes in QS. What we noticed was that the changes in FPB were bigger above a certain level of QS than below it. We believe this indicates there is a level at which a keyword’s minimum price is determined more by its own performance than by the minimum buy-in price of the search results page.
In other words, an advertiser who performs below average won’t see a large FPB price discount as a result of improving their Quality Score, until/unless they improve it to at least QS 6. Once they hit 6, improvements in Quality Score provide a more significant price discount.
The data showed us that there was a threshold around which changes in Quality Score started to have a much larger impact on first page bid estimates, so we think we found the average QS of AdWords that way. What we are seeing at Optmyzr is that there seems to be a QS threshold at 6 that indicates the average. At a QS score between 1 and ~5, moving between levels does not appear to have a major impact on costs. At a score between ~6 and 10, a jump between scores does carry more significant changes in cost.
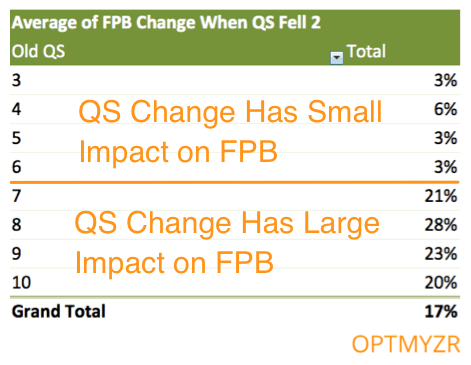
Optmyzr’s analysis of keywords whose QS dropped by 2 points shows that there are bigger changes in cost associated with QS movements above a level of 6.
We ran this analysis again with new data a week later and used a scatter plot to see if there was still a more significant change around a QS 6. Here’s what it looked like for keywords whose QS dropped 1 point.

Optmyzr’s analysis compared first page bids for keywords with a Quality Score drop of 1 point between Monday July 28 and Monday Aug 3.
In 2009, ClickEquations published that average QS was 7. Then in 2013 WordStream updated this data and shared that they saw an average QS of 5, so that’s roughly in line with what we are seeing. The average QS of 6 is also right in line with the new starting Quality Score Google assigns to new keywords with no impressions.
How Much Does Quality Score Change Impact Cost?
ClickEquations and WordStream attempted to quantify the impact of different Quality Scores on CPCs. Unfortunately, I believe their models are wrong because they are overly simplistic, which is not a good thing when we all know that nothing at Google is ever simple. That’s just the reality that comes with advanced computer learning systems like the one that handles QS for AdWords.
Screenshot from WordStream, taken August 2, 2015.
These simple models make the assumption that the Quality Score Google reports is linear, i.e., a QS of 4 is twice as good as a QS of 2. Obviously, they are correct that 2 is half of 4, but what they miss is that these numbers are mere representations of another number, the one used to calculate ad rank.
Remember that before Quality Score was introduced in 2005, the ad rank was CTR multiplied by max CPC, which means that even though advertisers bid a cost-per-click, they compete in a CPM auction. CPM auctions are good for publishers like Google because it means they have more control over their revenues. Simply put, a CPM publisher who doubles page views will double their revenue, something that is not as simple if they were ranking ads purely based on max CPC. What I am arguing is that rather than talking about QS, we should talk about predicted CTR when we try to calculate ad ranks or effective CPCs.
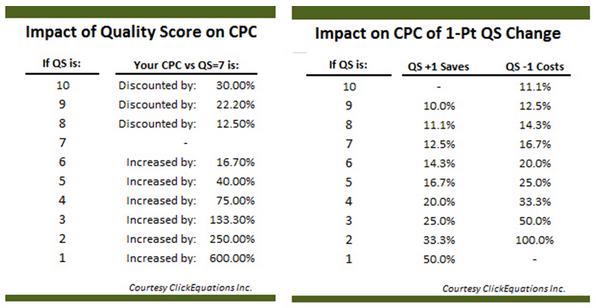
The table from ClickEquations suggests that a jump in QS from 2 to 4 happens by doubling the CTR. Let’s run with that and make some simple assumptions.
Say a QS of 1 corresponds to about a 1% CTR. If QS was linear, a 10% CTR would then get you a QS of 10. Anything beyond that would not get you a better QS or improve your CPC. That makes no sense.
I conclude that Quality Score is not linear with CTR. The QS number Google shows is merely a representation of a range of CTRs, and that range can be different for different QS levels. For example, a Quality Score of 1 could include CTRs between 1% and 2%, whereas a QS of 2 could span from 2% to 4%, a range that’s twice as large (so not linear).
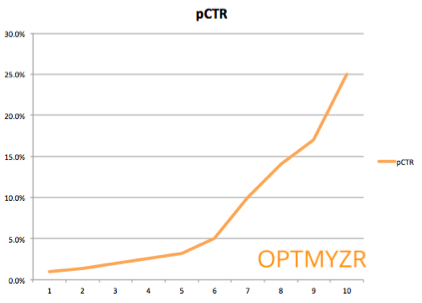
This is an example of what QS might look like if the model is not linear. Each level of QS corresponds to a range of pCTRs. In this fictional example, low QS numbers (1-5) have a smaller range of corresponding pCTRs than higher QS numbers (6-10). In this model, a change in QS at the higher levels requires a bigger jump in CTR and hence would have a bigger impact on CPC costs.
So how much can advertisers really save by improving Quality Score? I will attempt to answer that question by correlating the first page bid estimates to QS while normalizing for day-of-week effects — and that’s something I am currently working on.
Day-of-week effects, by the way, are what we believe account for most FPB estimates increasing in our data, even for keywords with an improved QS. We compared numbers from a Sunday to a Monday, and we think that because auctions are more competitive on Mondays, FPBs were more likely to rise than fall.
Conclusion
While I haven’t yet answered how much we can save by improving Quality Score, I thought my initial findings were interesting enough to share sooner rather than later:
- First page bid estimates lag behind Quality Score updates in 70% of cases, so be careful when using these in bid strategies.
- There appears to be a larger CPC impact for Quality Scores of 6 or higher than for 5 or lower, suggesting that 6 is the average QS for AdWords, something that is supported by Google’s recent QS announcement.
- The 1 through 10 Quality Score number we see in accounts is not linear and should not be used to estimate cost savings associated with improving Quality Score.
Opinions expressed in this article are those of the guest author and not necessarily Search Engine Land. Staff authors are listed here.
Related stories
About the author