Paid Search Portfolios: The Good, The Bad & The Ugly
Last month, I suggested that spending beyond observed profit maximization in paid search can make a great deal of sense on a number of grounds. In a nutshell, the argument is that a combination of other factors can make “losing money” on the incremental investment rational. Here’s why: You might not actually be losing money. […]
Last month, I suggested that spending beyond observed profit maximization in paid search can make a great deal of sense on a number of grounds. In a nutshell, the argument is that a combination of other factors can make “losing money” on the incremental investment rational. Here’s why:
- You might not actually be losing money. There is more “return” than meets the eye.
- There is cookie breakage
- There are cross-device tracking losses
- There is affiliate cannibalization
- There is offline spillover
- There are other valuable actions you may not be crediting to paid search
- Short term losses might be more than made up for by long term gains resulting from taking a portfolio view of the investment. There is long term gain in investing more due to:
- Customer lifetime value
- Benefits of greater scale with vendors or advertising partners
- Greater word-of-mouth base
- Replacing customer attrition
- Using the proceeds of the best investments to invest in additional growth
This second point on portfolios is the subject of today’s post.
Taking The Long-Term View
The graphs below are drawn from this hypothetical data set which you can download here to play around with: Diminishing Returns (Excel)
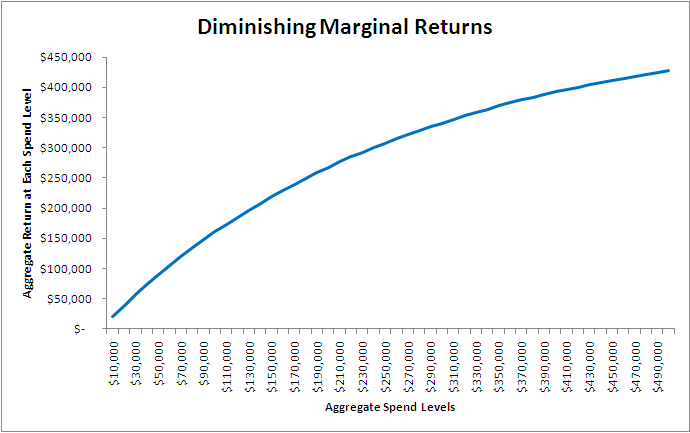
The below graph represents a normal healthy diminishing marginal returns scenario. Returns diminish because we make smart buying decisions. We buy the most effective media with the first bit of the budget and the next most effective second, etc. To be clear, we’re talking about different levels of media spend over the same time period. If you only had $10K to spend, you’d cherry pick, right?
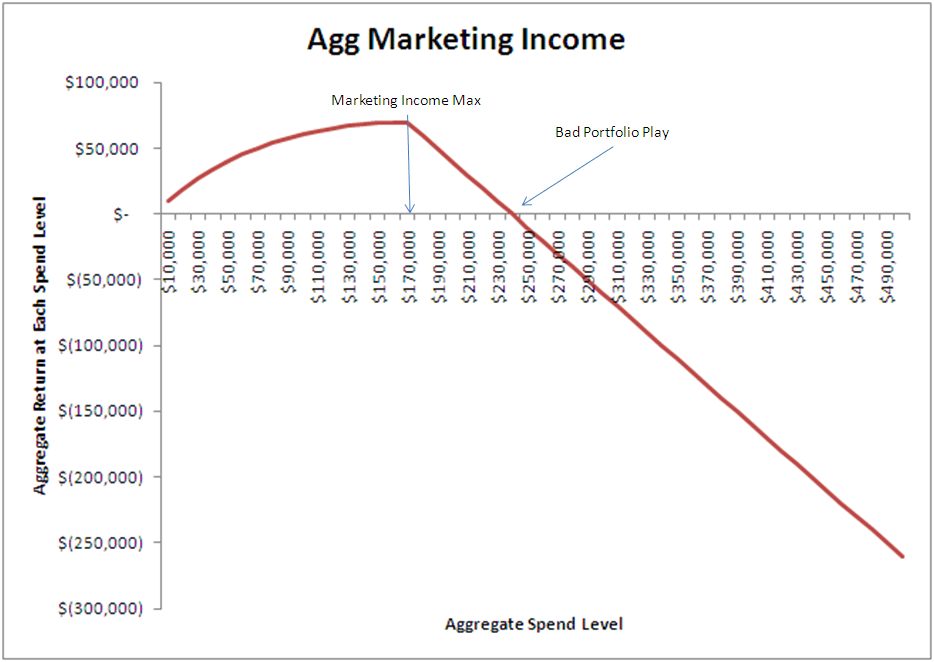
“Returns” could be anything: revenue less cost of goods, leads that have understood value, app downloads, advertising revenue, whatever. If we then subtract the advertising costs themselves we get to something I’ll call Marketing Income. We then have the same data presented below.
For the sake of argument, let’s work under the assumption that we have a crystal ball and have included estimates for all of those missing bits of value we enumerated in #1 above. The highest rate of return happens with the very first dollar spent.
The greatest aggregate Marketing Income happens at $170K in spend when the incremental returns exactly match the incremental advertising costs, so the slope of the curve at that point is zero. After that point the marketing income from each incremental increase in spend turns negative all the way to $380K in spend where we’re at zero Marketing Income.
Question: Why would you go there?
Answer: To make more money down the road and avoid a marketing death spiral
A Good Portfolio
In a good portfolio, the marketer has taken advantage of the lowest hanging fruit principle to generate a diminishing returns curve. We’re comfortable going beyond profit maximization to spending $380K on the graph on the grounds that the portfolio as a whole is cash neutral and that the additional customers reached by pushing beyond $170K to $380K are acquired at a defensible price.
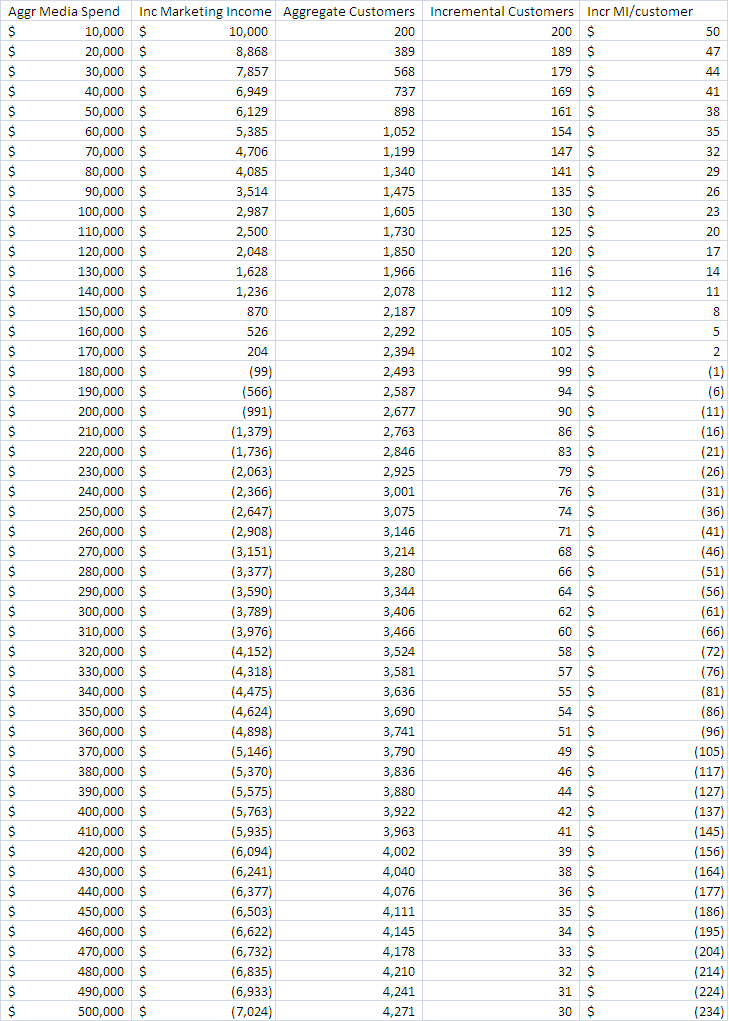
The table below was used to create the graphs shown so far and shows the customers acquired by the additional spend levels as well as the associated costs and returns.
Increasing spend from $170K to $380K means acquiring an additional 1,442 customers at an average cost of $52 per customer — you reach this conclusion by summing the Incremental Marketing Income (loss) from $170K to $380K and dividing by the Incremental customers gained. We valued a customer interaction (lead, order, whatever) at $100 for this data set, so a $52 loss means all of the value of the first interaction ($100) was spent on marketing, plus another $52.
Depending on the business, such a loss might absolutely be defensible on the grounds of customer lifetime value, word-of-mouth value, scale advantages, and replacing customer attrition.
Looking at the incremental returns by segment, you might push back and say: “okay the $52 average I can stomach, but the $100+ loss of those last increments just can’t be justified.” Fair enough, it may be smart to pull back a few notches.
One last argument that you could advance if you’re ambitious and want to push beyond the $380K figure in the example to an overall loss per customer of $50 is to say: “Look, the efficiency of the initial paid search investment is so great — throwing off cash to generate customers — that we should reinvest that money in growth until it hurts.”
It’s like finding a $100 bill on the sidewalk. You could keep the $100 and feel good about the day, or you could use the $100 to buy lottery tickets and try to turn it into a life-changing day. If you lose the $100, it’s a shame, but you’re losing “found” money; why not try to parlay that into something amazing?
All these arguments are premised on buying deeper into a good portfolio.
A Bad Portfolio
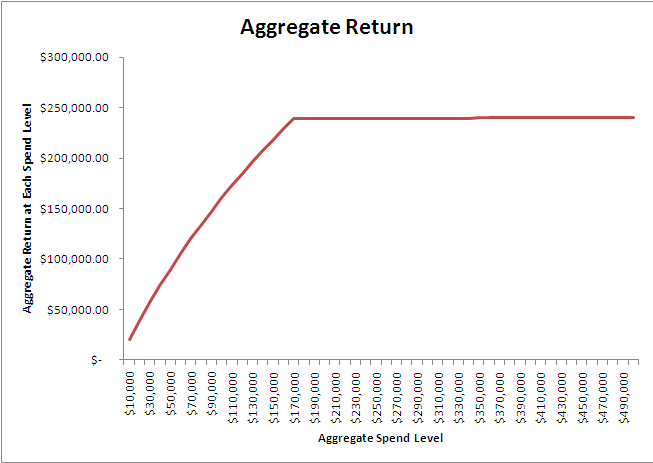
A good portfolio can turn into a bad portfolio based on the shape of the diminishing returns curve. In this example — extreme to make the point — beyond the point of profit maximization the curve flattens out entirely: you can spend more but there simply isn’t anything more to get from the channel.
This can happen in paid search when your ads are effectively at the top of the page for everything and/or your competitors are spending so much more aggressively that you can’t raise bids by justifiable amounts to generate meaningfully greater traffic/value/revenue.
If the Marketing Income graph looks like this, stopping short and forgetting the portfolio argument makes total sense. Otherwise you’re just putting money into a shredder.
An Ugly Portfolio
An ugly portfolio is produced by buying media to follow some strategy that isn’t connected to observed results. Following a strategic vision rather than following the data leads essentially to picking fruit in random order instead of the lowest hanging fruit first, meaning the returns generated from the amount spent do not reflect the greatest return possible for that level of expenditure.
Making arbitrary spending decisions like:
“I want to be in position 2 for these keywords, position 5 for these keywords and position 7 for these others,” or
“I want maximum impression share for these ads, but not those,” or
“Let’s bid $1 for these ads, $2 for those, and $3 for these,” or
“If someone has visited my YouTube channel, spend $10 for them”
“I don’t want to spend money on PLAs; Google Shopping used to be free so I’m not going to pay for it now”
All these decisions may have some rationale behind them (“Californians are fickle customers, so we don’t want to advertise to them…”) but unless they are also in line with observed data they lead to random allocation of budget and represent huge missed opportunities for growth and efficiency improvements.
It’s like the classic Mike Tyson line when asked about his next opponent’s strategy for beating Iron Mike: “Everybody has a plan ’til they get punched in the mouth.” Data should be that cold hard punch.
The signs of an ugly portfolio appear when we find in granular performance data a collection of ads that are mid- to high- traffic that are hemorrhaging money, still active, and still generating significant traffic, while, at the same time, there are other ads or collections of similar ads that individually or collectively are hugely efficient but not in prominent ad positions and not generating tons of traffic.
The “portfolio” as a whole might have a positive ROI, but, because it’s an ugly portfolio, it doesn’t have nearly the scale or efficiency it could have if data drove decisions rather than opinions.
Even in 2014, with all the professional paid search software available to make ad buying mathematically rational, we see a startling number of ugly portfolios out there when reviewing programs managed by others.
Evaluating The Curve
Let’s assume you’ve avoided the pitfalls of the ugly portfolio and drive by data. Let’s assume you’ve done all the blocking and tackling associated with keyword builds, feed optimization for PLAs, ad copy and landing page testing, match types, negatives, dayparting, geo-targeting — the whole nine yards. The program is hitting on all cylinders.
How do you know where you are on the diminishing returns curve, and whether the next level of spending or the last, for that matter, makes sense? How do you know whether you’re in good, defensible portfolio land or bad, indefensible portfolio land?
Google’s Bid Simulator Data is still the best tool available for assessing the marginal return on investment granularly. Smart testing of the landscaping: pushing where data suggests the best marginal return on ad spend is likely makes excellent sense, as does pulling back where the projected loss of traffic is small relative to the cost savings.
We also entered this detailed discussion with the assumption that we already had a good handle on the harder to measure parts of the value equation. Make sure you have a handle on that before pulling back.
Finally, understand your business metrics relating to lifetime value and try to get a handle on word-of-mouth value (see the end of last month’s article for a method for getting at this).
Conclusion
Building a portfolio that pays dividends over the long haul should be everyone’s goal, and we must find our unique answers in our own performance data. The temptation to use paid search as a cash machine is powerful and we need to make sure that we aren’t setting ourselves on a course towards a death spiral with an ever shrinking customer base by thinking about short term profits more than long term business health.
Opinions expressed in this article are those of the guest author and not necessarily Search Engine Land. Staff authors are listed here.
Related stories


