Searcher intent: The secret ingredient behind successful content development
Contributor Dave Davies takes the guesswork out of determining what type of content will resonate with an audience by creating Excel formulas to help determine what a searcher may be looking for.
 Google’s goal is to satisfy a searcher’s intent. When a user finds what they’re looking for after clicking on an organic search result, that’s a success.
Sounds easy enough, but things get complicated when there are multiple results that may fulfill the primary intent of a given query.
What is “the primary intent of a given query?” Let’s look at the search phrase “Real estate in Miami” to help answer the question.
Primary intent
Someone searching the term “real estate in Miami” is probably looking to either buy or sell a property. This is the primary intent of the search phrase. We could search virtually any site that accesses a Multiple Listing Service (MLS) in the United States and finds results using the phrase.
Algorithms use math and math (in this context) and rely on probability. When Google is determining which results to rank highest, they are looking to maximize the probability that the searcher will leave satisfied. When many indexed sites meet a primary intent, the algorithm needs to look at secondary intents to see what other information the searcher may be looking for.
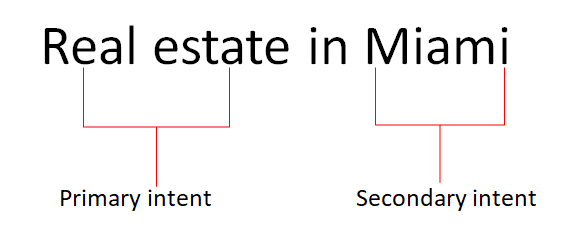
Secondary intents increase the probability a site will meet their intent. Here’s a very simple example:
- Assume 90 percent of the searchers were looking to buy or sell real estate.
- Assume that 10 percent of the searchers were looking for information on the real estate market in Miami.
Most, if not all sites, will fulfill the 90 percent of intents, but only those sites with information on the market itself (Miami) on top of the listings would fulfill 100 percent of the users’ intents.
In the absence of such a site, Google must provide listings that fulfill different intents, knowing any given searcher may potentially click the result that fulfills the wrong intent and be disappointed.
This happens when it’s the only option Google has, or for diversity, but when a single resource fulfills multiple intents and thus increases the probability they will satisfy the user, that site is more likely to rank.
There is supplemental data that doesn’t match the first intents but which does match supplemental needs. When a searcher has fulfilled their primary intent (found properties of interest, read the market research and so on), it’s logical that they may have a next step.
For example, when searching for real estate in Miami, it’s logical to want to know what schools are in the area, the crime rate, property values and more. Once you find a site that provides the information, and based on history, Google knows what query will probably be searched on next.
If your website contains the information of the next request, there is a high probability that your site will fulfill that searcher’s intent.
You need to be a fortune teller
This leaves you, me and everyone else with the problem of determining exactly what “user intent” means.
This is especially annoying if you like to work with hard numbers. How do you put a hard number on something like meeting user intent? With complex machine learning algorithms, a massive data center and a sneak peek at Google’s algorithms, it might be possible, but let’s assume for a second we don’t have the time, skill or resources for that.
I had to come up with a way to determine where the holes were in the canvas we’re painting to satisfying user intent and come up with a way of determining where these holes were acceptable and where they were not.
Step 1: Building a keyword list
The first step is going to be building a keyword list. Chances are you’ve done this before, but this time we’re going to be expanding our search beyond those conversion phrases we often focus on.
The conversion phrases you probably already have in your lists are likely (though not necessarily) focused on primary intent terms. If you are a realtor in Miami, terms like “Miami real estate” are on your list.
This time, we’re going to take a different approach. We’re going to look for the secondary and supplemental intent terms, which can be a tedious task but incredibly valuable.
The first thing you’ll do is head over to your favorite keyword research tools. Each has its pros and cons, but thankfully, for our purposes, it doesn’t really matter which you use. We’re not looking for traffic estimates, we’re looking for content ideas so that specific search volumes don’t matter as much as understanding the ratios.
I’m going to assume everyone in the audience either has access to Google’s Keyword Planner or can convert the process to the tool you use. Now it’s time to build your list.
How broad you want to go on your keyword research will vary by your niche, but I generally suggest going as broad as possible. In this instance, I would start with the single word “Miami” and get the results:
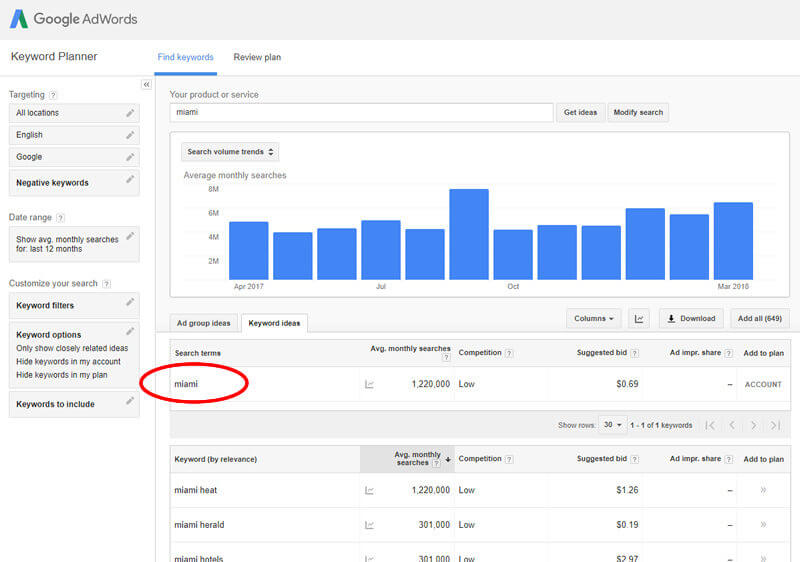
Add all the keywords to a plan, making sure to choose “exact” as the match type. Doing so does not actually add all the top queries that include “Miami”; Google reduces the queries to what they deem likely, so they don’t include everything.
To supplement this list and ensure you are getting all the most important terms, you’ll also want to query “Miami real estate,” “Miami homes,” “Miami neighborhoods,” “Miami mortgages” and pretty much anything else you can think of that your target market might look for related to primary and secondary intents.
Download your list and delete all the columns other than the Keyword and Average Monthly Searches (exact match only). Now the real work begins.
Step 2: Time to classify
The next step is to classify your keywords.
Group your terms together by their intent. The more granular you get, the better.
You can use whatever system you like to classify your keywords. To keep things simple, I tend to add a column to my spreadsheet and use an alphanumeric key.
If it’s a short list with a few classes, I’ll use numbers. If it’s a larger list, I’ll go with letters or a combination depending mostly on keyboard position.
It’s important to also keep a notepad doc or similar log of what your classifications mean. It’s only worth classifying items that might conceivably be of interest to a searcher prior to, during or shortly after the conversion cycle.
I kept the categorization a little more basic here. For example, you may notice I lumped all events into one class to include everything from “what to do” queries to places to go. There are times when a broad approach like this may work well as a first round, followed by a second round of this same research for each section if it’s going to be a substantial build-out. I won’t be taking it that far, but this needed to be noted.
At the end of this stage, you’ll have something that looks like:

Step 3: Numbering
The next step is to put some numbers on the various types of content.
You’ve determined all the queries not classified “not applicable” (NA) could be involved at some point in the searcher’s journey. Using what we have, we can see how each of these areas can assist in improving the probability of our site meeting a user’s intent.
1. First, delete all the rows for keywords that have zero relevance.
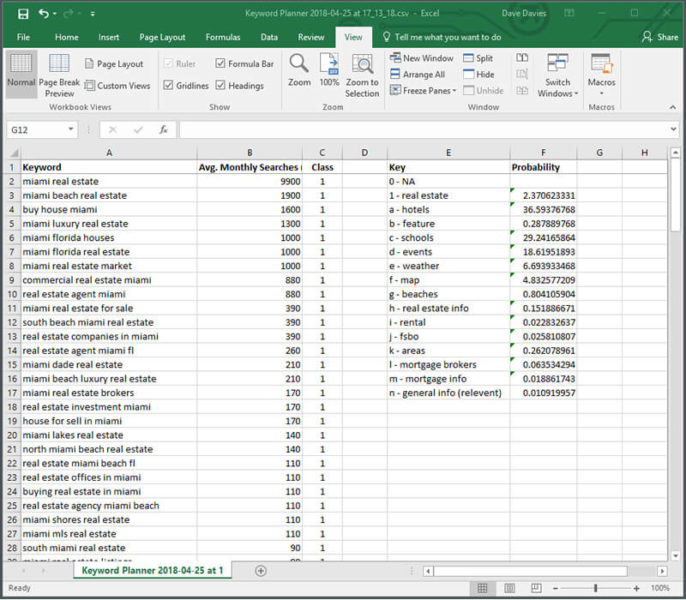
2. Order by class and then add the key and a probability field like:
 3. The next step is to find the total volume of queries that relate in some way to a conversion using the SUM feature:
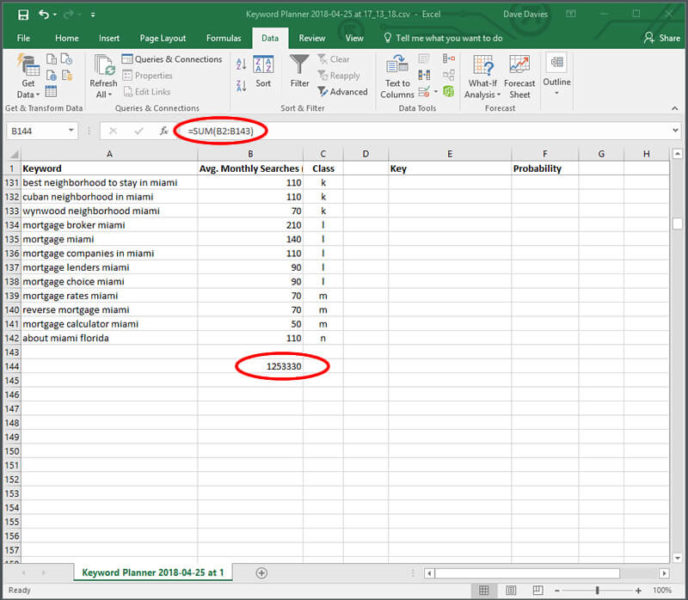 4. And finally, you’ll use the SUM again to find the percentage impact a specific grouping of content has on intent (with a big BIG caveat we’ll get to shortly). In the probability field for each key entry, you’ll simply add the formula: =SUM(B2:B43)*100/B144
Adjusting the bolded B2:B43 to reflect the class rows (e.g., in rows 2 through 43 in my spreadsheet we had the values for class 1 (real estate).
This part of the formula will add these cells together. The bolded B144 is to be replaced by the cell you created in Step 3 giving the total search volume of all queries.
Altogether, this formula creates the percentage of all relevant searches that each class represents. In our case, we get:
In the last step, we need to adjust the weight because some classes are relevant but not equal.
A user looking for mortgage information is obviously more likely to be interested in real estate than one looking for weather information. So, we need to adjust the numbers based on their impact on the specific users we’re targeting. To do this, we need to add three final columns. Here’s what the final product will look like:
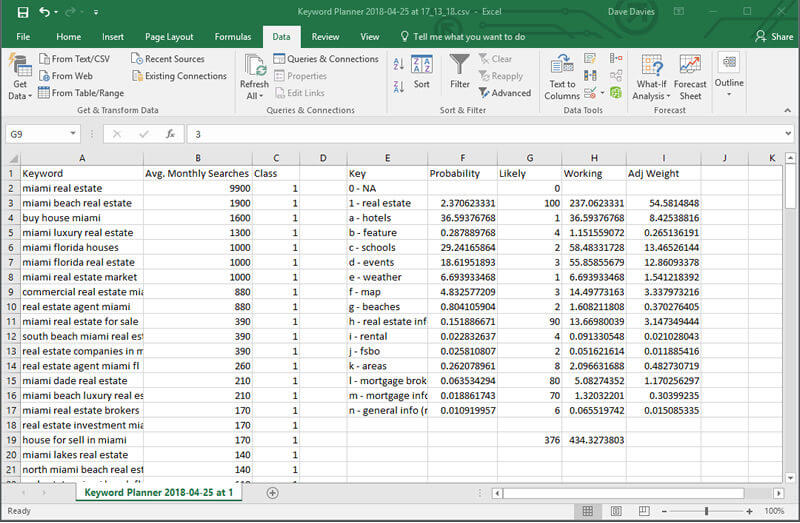
The first column we will add is G, which I have titled “Likely.” It uses a scale of 100.
I have graded what I believe is the likelihood a searcher of that class of terms would be related to my users.
In my example, I believe 2 percent of users searching for schools are interested in real estate.
In column H, I have added a “Working” column, which is an adjusted value. I need to know what the probability column values would be when I take into account the multiplier from the “Likely” column.
You will notice the “real estate” value is multiplied by 100 in the “Working” column, as it had a “Likely” multiplier of 100. “Schools” only doubled, as it had a multiplier of 2.
This is done by adding the following formula into cell H3: =F3*G3
If you select the bottom-left corner of the top cell and drag it down (or double-click it), the formula will copy down through the rows you have a “Probability” value for.
Once that’s done, use the SUM formula to add and total all the adjusted values which (in my case) became ~434.38.
And now, the final step is to add the following formula into I3 in what I’ve called my “Adj Weight” column: =F3*G3/$H$19*100
Drag it down or double-click, and you will need to adjust the bold in the formula to reference the SUM cell in column H.
Notice I have placed a string ($) before the column and row references. When you drag a formula cell to copy it to rows below it, the values change. What was a reference to cell F3 would adjust to cell F4. By placing the string ($) before each value, we stop this from happening, in this case, locking the reference to cell H19 instead of having that value change to H20, H21 and so on.
This formula gives us the percentage weight of each class after our “Likely” value is factored in.
Now we have a roadmap
Now we have a roadmap for content development, and we have assigned a probability to the various content classes.
As with almost all data, this needs to be viewed with a critical eye, but it gives us a very good starting point as to where our opportunities lie and where we should be looking to expand our content to increase the probability of meeting the searcher’s intent.
If the only content that appeared on the site was real estate listings you would have a 54.58 percent probability of meeting the searcher’s intent (when we include secondary and supplemental intents).
If we add content related to schools in the area, we will be adding 13.46 percent probability to our example.
One major consideration to keep in mind is that it all relies on your choosing the right “Likely” values.
Choose incorrectly and you will skew to the wrong types of content. Before launching into valuing classes of content, I generally review the content of the top 10 sites for my primary terms AND also view the top five or 10 sites for content ranking for that class.
This will assist in confirming that you are correct in your valuation; if some or more of your ranking competitors have this content it increases the odds that it is indeed valuable and you’ve assigned correctly.
Reviewing the sites that rank for content using specific keywords will also assist in confirming your interpretation of what the query means or what Google believes the users are looking for is correct.
Conclusion
This is how you put numbers on your content classes to get an idea what types of content will increase the probability that you will meet your searcher’s intent.
In this fast-changing and crucial area of search engine optimization (SEO), this method can help you keep focused on what’s most likely to move the ranking needle.
Opinions expressed in this article are those of the guest author and not necessarily Search Engine Land. Staff authors are listed here.
Related stories
About the author