SEO Reports Putting The C-Suite To Sleep? Bring Out The Graphs
Columnist Purna Virji provides examples of visual aids which can help key stakeholders understand your SEO progress at a glance.

Let’s face it… long SEO reports can be tedious to read.
However, SEO reports are also vital components of what you do — so how can you help key stakeholders (like the C-suite) absorb salient information and better understand the value you bring without putting them to sleep at their desks?
The answer is simple. Compile your profit and loss (P&L) data into eye-catching graphs. As we all know, a picture paints a thousand words — and visual data in the form of succinct, attractive, and easy-to-digest graphs can answer the executives’ core questions on performance and trends with just a quick glance.
Want to create SEO reports your C-suite execs want to read? Here are some graphs that will brighten their day.
Quick Note: If you aren’t able to get revenue data from your clients, you can use conversions as an acceptable substitute in the graphs below.
The Weekly SEO Graph
Graphs are not only refreshingly easy to read and process, they are also refreshingly easy to create. So there’s no reason why you can’t be updating your executives with new graphs every week.
These will help the C-suite feel in the loop, give them the confidence you are adhering to plan, and can also help make your case if you’re in need of some additional resources for the month.
Creating graphs couldn’t be simpler, as you can use the data you already collect:
- Take leads or conversions as well as revenue (if you have this) and plot them by week.
- If you have goals or revenue targets, plot these alongside the former, so executives can see at a glance how you’re tracking week to week.
- In addition, show your progress as well as your current performance by mapping it out on a rolling 90-day basis.

The best part? Once you have the graph set up, it only takes a minute or two each week to put together.
Kick It Up A Notch
You could further enhance this weekly report by adding in annotations to highlight all key developments and actions, to help answer the “why” behind the “what.”
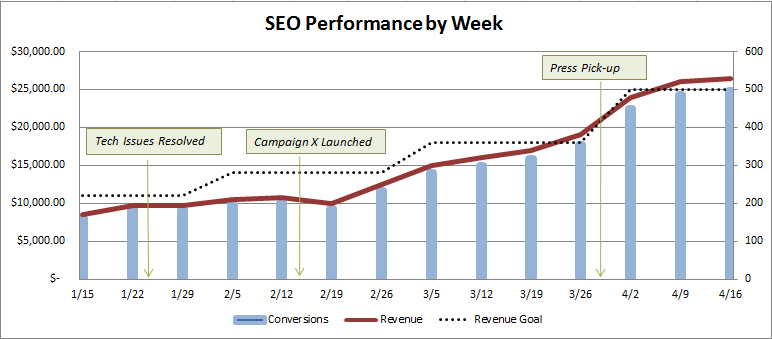
This information-rich graph answers several questions that would otherwise take huge chunks of text to explain (and send your bosses into slumber). Here are some of questions an annotated graph can answer:
- How’s our current performance?
- How have our efforts progressed?
- What has correlated with significant dips or increases in performance?
From an audience perspective, a graph like this only takes around 90 seconds to read (something the C-suite can easily slot into their day) but will leave viewers with an in-depth understanding of the situation. These graphs are also great for kicking off SEO team meetings to quickly get everyone on the same page.
The Monthly SEO Graphs
Monthly reports share a higher-level view of P&L progress with the executives, allowing them to assess your monthly performance and view your upcoming strategy.
There are a few different ways you can present monthly information in an eye-catching graph. This first bar chart shows revenue progress month by month in comparison to your goal.
Here’s how to create it:
- Choose a time frame that best suits your needs. A six-month view is usually sufficient, but you may need to adjust depending on your client.
- Plot the actual revenue-by-month data for these six months (including the latest month).
- Plot the forecasted — or alternatively, trended — revenue data for the upcoming two months.
- If you have monthly goals, plot these within the graph as well.

This graph is helpful because all key past performance data is right in here; the executives won’t have to search for and open up previous monthly reports to get a view on performance. Plus, with the addition of the forecast for the next 60 days, we can set expectations for performance to come.
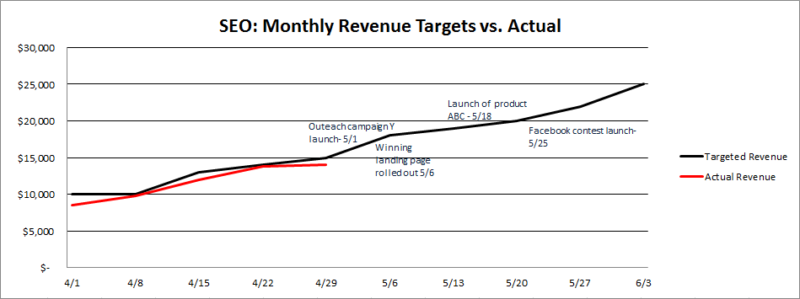
Another easy-to-digest way to present monthly information is in the form of a line graph. The following example drills even deeper into your performance, plotting revenue performance against goals for the past month and also looking at projections for the coming month.
The graph shows month-end performance and revenue expectations by week for the upcoming month, while annotations outline what strategies will be deployed and when, as well as how this will impact revenue.
You can easily put together a graph like this in five minutes using the data you already have. Here’s how:
- Break the current month and the next month into weekly chunks.
- Start by adding your actual revenue into the graph.
- Then, if you have revenue goals, plot these, too (or else use some projection data).
Other Benefits
Using graphs in your SEO reports is win-win for every party. CEOs will discover that looking through SEO reports can be a pleasure, not a chore, saving their time and giving them the key information they need at a glance.
For SEOs, the graphs allow you to clearly demonstrate how your SEO work is directly helping the company to develop, aligning your goals with the top brass and earning you their trust and respect.
And that’s not all. Creating these P&L graphs and charts also you to better plan your monthly strategy by keeping revenue front-of-mind, so you can be more mindful in your strategy selection and prioritization process, ensuring you focus only on things that can have the biggest impact.
Last but not least, using visual aids significantly cuts down the amount of dry copy you need to write for reports. Making it not only quicker and easier for the execs, but also quicker and more enjoyable for you.
Opinions expressed in this article are those of the guest author and not necessarily Search Engine Land. Staff authors are listed here.
Related stories
New on Search Engine Land
About the author