Sometimes You Just Need To Go With Your Gut In Data Analysis
It is difficult to understand why statisticians commonly limit their inquiries to Averages, and do not revel in more comprehensive views. Their souls seem as dull to the charm of variety as that of the native of one of our flat English counties, whose retrospect of Switzerland was that, if its mountains could be thrown […]
It is difficult to understand why statisticians commonly limit their inquiries to Averages, and do not revel in more comprehensive views. Their souls seem as dull to the charm of variety as that of the native of one of our flat English counties, whose retrospect of Switzerland was that, if its mountains could be thrown into its lakes, two nuisances would be got rid of at once. An Average is but a solitary fact, whereas if a single other fact be added to it, an entire Normal Scheme, which nearly corresponds to the observed one, starts potentially into existence.
Some people hate the very name of statistics, but I find them full of beauty and interest. Whenever they are not brutalised, but delicately handled by the higher methods, and are warily interpreted, their power of dealing with complicated phenomena is extraordinary. They are the only tools by which an opening can be cut through the formidable thicket of difficulties that bars the path of those who pursue the Science of man.
— Sir Francis Galton
Natural Inheritance (1889), 62-3
Data analysis can be overhyped. We are taught to believe that with the right data analysis, we can understand everything around us and make rational decisions in our best interests. We are even shown how to do this in our schools and universities where we analyze datasets and are asked to infer insights.
The trouble is, the datasets we are taught on are unrealistic. Unlike toy datasets, real marketing data is often incomplete, sparse and some times even wrongly entered. So while it would be possible to come up with crystal clear conclusions if the data were robust, we are often forced to make decisions with partial or small datasets.
In these situations, we must combine the analysis with some heuristics and gut checks to come up with our conclusions. This is best understood with an example.
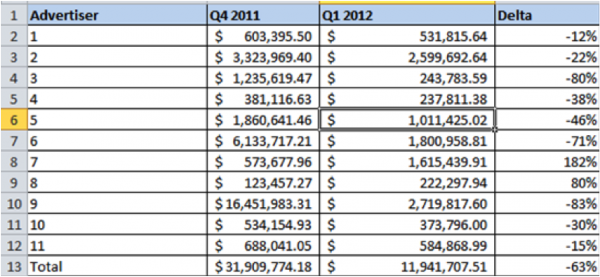
You are asked to find the quarter on quarter change in spend for advertisers based on a small sample. (The data has been randomized and is not representative of any real advertiser.)
The simple thing to do here is to take the average across all advertisers and measure change i.e. measure the change on the total. The change in this case is -63%. So is this reflective of the marketplace? Let us explore this data a bit further.
Step 1: Directional Trends
Are we sure that the overall trend is positive or negative? If we breakdown trends by advertiser, we get this chart:

Note that 9 out of 11 advertisers show a drop in spend. Further, we know from our knowledge of the retail vertical that spend usually drops in Q1 wrt the Q4 holiday season. So we are confident that the spend trend is negative.
Step 2: Identification & Treatment Of Outliers
A closer look at the sample reveals that in Q4, over 50% of spend came from advertiser 9, the same advertiser dropped spend by 83%. In such cases, it is useful to measure the median change across the sample. Further, we can also measure the change without Advertiser 9.
| Statistic | Change |
| Mean without advertiser 9 | -40% |
| Median change | -30% |
Clearly, Advertiser 9 is biasing our results. Another way to check the impact of the advertisers is to measure the average drop without each advertiser present in the sample. So we measure the mean drop in spend without advertiser 1,2,3 etc.
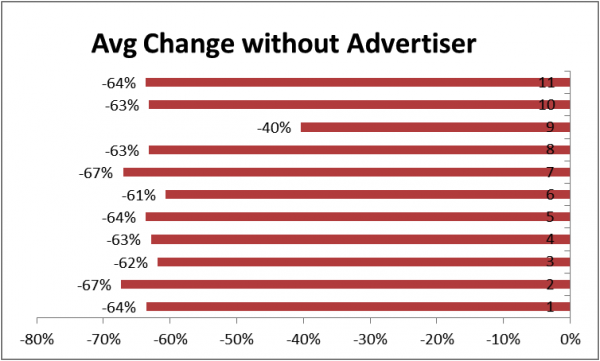
Note how stable the estimates are for all but advertiser 9. Most estimates hover around -60% but without advertiser 9, it drops to -31%. Clearly advertiser 9 is biasing the results negatively.
Step 3: Cross Checking The Data
If possible, we should try to come to our estimate by other means. So we try another approach. If we order advertisers by spend and then calculate the change in spend cumulatively, what trend to we see?
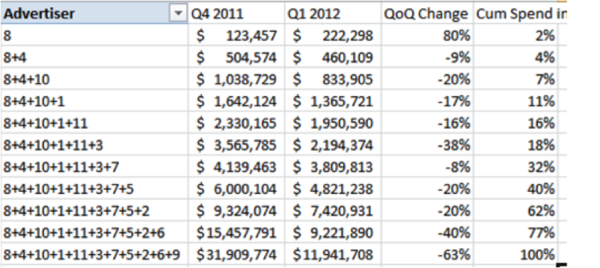
Two things become very apparent:
- Without advertiser 9, the sample represents 77% of spend in Q1 and the change in spend between Q4 and Q1 is -40%.
- As we add larger advertiser the change in spend generally becomes increasingly negative. This indicates that larger advertisers dropped spend more than smaller advertisers in general; something that we might want to investigate further.
Step 4: Coming Up With The Estimate
This is the hardest and most controversial part. Here are the estimates that we have:
| Method | Estimate |
| Mean (all) | -60% |
| Mean (without Advertiser 9) | -40% |
| Median | -30% |
| Mean without top 2 advertisers | -20% |
Given all these estimates, I would feel fairly comfortable in saying that spend has declined between 25% and 35% between quarters. Of course, I am mixing estimates with my gut feeling here and here is where it gets subjective.
In conclusion, when working with partial or sparse data, try to see the data from different angles rather than just the overall average.
Further, gut check your analysis with your domain knowledge. This is hard when your analysis shows something unexpected. If it is an unexpected number, it might really be a new insight or it might be a wrong conclusion.
At these times, your gut can really lead you to the right path or completely astray.
Hence, check your conclusions in different ways. The difference between an average analyst and the best ones, are that the best analysts know when to trust their instinct and when not to. That cannot be taught; it comes with experience.
Opinions expressed in this article are those of the guest author and not necessarily Search Engine Land. Staff authors are listed here.
Related stories
About the author