What’s The Next Big Metric For Creative Optimization?
As keyword lists expand, they often outgrow the groups that were initially created to contain them. For example, a group that started out with a single keyword, [running shoes], could expand over time to contain [running shoes], [womens running shoes], [jogging shoes] and [black running shoes], among others. The original creative that was generated to […]
As keyword lists expand, they often outgrow the groups that were initially created to contain them. For example, a group that started out with a single keyword, [running shoes], could expand over time to contain [running shoes], [womens running shoes], [jogging shoes] and [black running shoes], among others.
The original creative that was generated to match [running shoes] queries would be less relevant to the newly expanded keywords and, as a result, the overall click-through rate (CTR) of this group would decline.
This decline in group CTR, as keyword count increases, exposes a useful metric that should be considered when optimizing creative and keywords per group.
CTRs & Quality Scores
Groups with a large number of keywords often have lower CTRs and lower Quality Scores than groups with a concise and focused set of keywords. This is because the creative within densely populated groups can only leverage a subset of the group’s keyword tokens for maintaining relevance.
In our example above, the creative leverages the tokens [running] and [shoes] to remain highly relevant for [running shoes] queries. However, the creative lacks the tokens [womens], [jogging] and [black], so it would be less relevant for [womens running shoes], [jogging shoes] and [black running shoes] queries. This could potentially lead to lower CTRs and Quality Scores for these three keywords.
The best way to identify and prioritize groups for creative optimization is to generate a data table containing the number of keywords, the CTR and the cost of each group in the account:
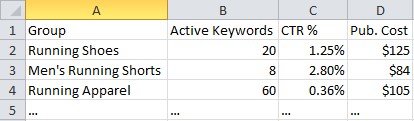
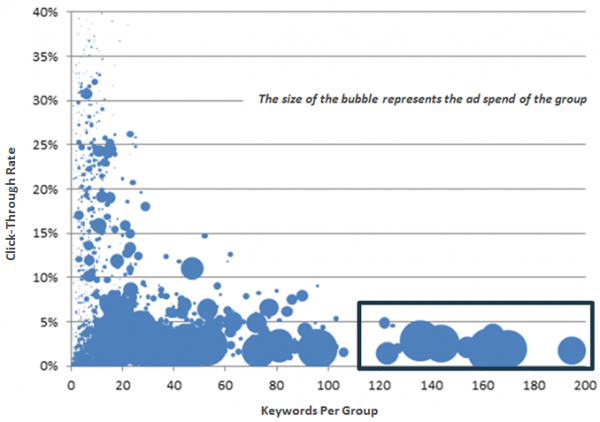
Then, create a bubble chart to plot the relationship between these three metrics:
Creative Optimization
Take note of the larger circles inside the box in the lower right hand corner of this sample bubble chart. This is a good example of groups that should be prioritized for creative optimization.
To do so, you would need to isolate less-relevant keywords within these groups and break them out into new groups that contain more relevant creative. In our example above, [jogging shoes] would be split out into a [Jogging Shoes] group with creative that utilize the token [jogging] rather than [running]. Executing on this optimization strategy would lead to improvements in CTR and Quality Score.
Quality Score
Be aware that Quality Score will reset for keywords that are split out into new groups. Prior to evaluating performance, allow an initial learning period for these new keywords to establish a meaningful Quality Score. As a best practice, check the status of each keyword and ensure that its bid is set above the first-page minimum.
During the learning period, it’s also a good idea to give these keywords an initial bid boost to increase ad position. A higher ad position promotes a higher CTR, which remains a significant factor in improving Quality Score.
Finally, don’t forget to optimize the newly created groups; setting appropriate keyword bids, generating relevant creative and researching negative keywords are just a few strategies to keep in mind.
Note: To help generate the data table and bubble chart above, current Marin Software users can leverage the Active Keywords metric under the Advanced Group Column category. Be sure to tag the split keywords and affected groups with Marin Dimensions to monitor and report on performance.
Opinions expressed in this article are those of the guest author and not necessarily Search Engine Land. Staff authors are listed here.
Related stories
About the author