3 Metrics Google Analytics Beginners Should Watch
The first login to a Google Analytics account can be daunting. There are so many things to see, and so many different ways to tweak data, that deciding which are the most important metrics to watch can be an insurmountable decision. Ultimately, in my opinion, you are the only one who can decide what metrics […]
The first login to a Google Analytics account can be daunting. There are so many things to see, and so many different ways to tweak data, that deciding which are the most important metrics to watch can be an insurmountable decision.
Ultimately, in my opinion, you are the only one who can decide what metrics and reports are important to your business.
Some websites don’t collect money but do send traffic to other sites, or collect subscriptions or email sign-ups as a form of conversion. Some do collect money, but it’s just a small portion of their business; the phone call may really be considered a conversion.
So how do you put it all together and come up with useful data from your Analytics account?
The first thing we need to talk about, before we get into reports, is your Dashboard. Each report you use can be ported into your dashboard, so you can see data at a glance. Please be sure you’re using Analytics 5 or the “New” version.

If the top right of your page says “New Version” and is clickable, you’re looking at the “old version” and should switch right away.
I’ll share with you the top three things I think you should look at as you start through your Analytics journey. Feel free to add to this list in the comments below if there is a report that is especially useful to a beginner.
Visitors
 Figuring out how your website is being used, and using that knowledge to make it better, starts with the visitor.
Knowing who is coming to your site, how long they spend on the site and each page, and how many pages they look at before leaving or buying can give valuable insight into improving your subscription or checkout process.
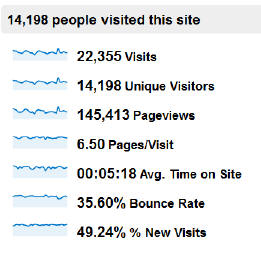
From the Visitor Overview report, you can see a “snapshot” of data for your site over a particular period of time.
I look at about four metrics on this overview report on a regular basis:
- Visits
- Unique visitors
- Pages per visit
- Average time on site
- Bounce rate
A lot of people ask me “What should my bounce rate be?” or “How many pages should my users see per visit?” Honestly, I can’t answer that for you. Every industry is different, every conversion type is different.
For example, if you want people to sign up for an email newsletter, you could get them to do that on the first page they visit. One page per visit will result in a conversion, so one page per visit isn’t bad. If you sell $4,000-a-night vacation rentals, likely the more pages people look at, the more likely they are to book, so we want that number higher.
Ultimately, I advise you to watch your visitor metrics for major dips and peaks.
Did you redesign your site and your bounce rate went up drastically? Figure out why and fix it. Did you implement some changes that you thought would help but saw traffic drop drastically? Visitor analytics can help you watch and see those changes so you can adjust as quickly as possible.
Sources
 The source of your traffic is another extremely important metric. A new website might see most of the traffic come from branded search, paid advertising or direct type-in.
As you implement optimized changes, and achieve more organic rankings for keyword phrases, you’ll see organic visits increase and might have the opportunity to decrease your paid advertising.
(Note: Think about decreasing or eliminating PPC budget carefully — it’s not always a good idea.)
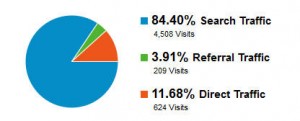
 Traffic sources overview report is the starting page to gaining insight into how people find your website. I think it is quite important to pay attention to the pie chart you see near the top of the overview page.
Not everyone agrees, but I think having a healthy balance of search, referral and direct traffic is good for your business.
If you have 84% organic search or paid search traffic like the company in the graph above, and Google makes an algorithm change that affects you (Panda update, anyone?), you can lose money extremely quickly.
If your sources are more balanced, and the same change affects traffic, it hurts, but not as much.
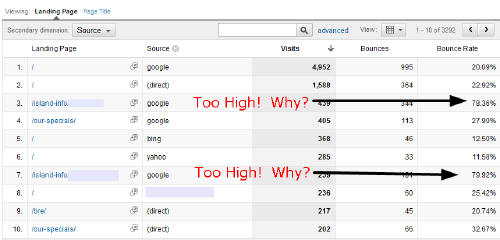
If you drill down a bit into your Traffic Source report, you can see which sources sent the most traffic. You might use this to determine whether a directory listing is worth the cost, or if your paid advertising is lucrative.
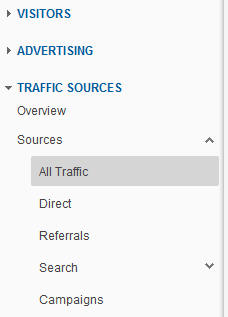
If you look at the individual source reports, you can see All Traffic, Direct, Referrals, Search and Campaigns. Campaigns is where your PPC accounts should live (see this “how to” in Google Analytics Help).
Landing Pages
Watching user metrics on your landing pages is a key metric to understanding whether the information you’re delivering matches the needs of the traffic you’re receiving.
You need to be sure your pay per click marketing is helping you, not just sucking your wallet dry. By keeping tabs on how your pay per click traffic performs once it hits your landing page, you can also mitigate lost dollars and improve landing pages to help visitors get what they are looking for from query to landing on and navigating your website.
High bounce rates on paid advertising landing pages mean you need to improve that experience for the user. High bounce rates on PPC landing pages could also be inflating your cost per click, because the quality score for that keyword in Google AdWords is probably pretty poor.
It’s important to watch the behavior of all traffic on your landing page. Organic search traffic that results in a high bounce rate might mean the ideas you’re optimizing that page for don’t necessarily match what a user might be looking for.
It’s also a great way to keep tabs on an agency, if you have one, because you want the optimized pages to draw visitors, keep them on the site and encourage them to book. High exit percentages and bounce rates on landing pages are a great way to know if what you have is good enough, or needs help.
Conversions
OK, this makes four metrics to watch, not three as promised, but this one doesn’t always apply to everyone. If you do collect money or measure a conversion on your website, you should pay attention to this from the start.
It can be a tad tricky measuring dollars from your website, so you might want to find an expert who can get it set up and configured for you. If you’re a tech-type person, you can probably trial and error yourself through the setup using Google’s “how to” on configuring e-commerce tracking.
Ultimately, you know your business best. What works for you might not work for your competitors, or your business goals just might be different. Starting out somewhere is the key.
With the overwhelming amount of information, these three reports can help you get comfortable in Google Analytics so you feel confident digging deeper and understanding more complex metrics and what they mean for your business.
Opinions expressed in this article are those of the guest author and not necessarily Search Engine Land. Staff authors are listed here.
Related stories
About the author