5 practical data blending examples for smarter SEO insights
Here's a step-by-step guide to blending data tables from different tools to uncover valuable new insights using Python (or SQL).
Sometimes we face questions that are hard to answer with the information from isolated tools. One powerful technique we can use is to combine data from different tools to discover valuable new insights.
You can use Google Data Studio to perform data blending, but note that it’s limited to only one type of blending technique: a left outer join (discussed below). I will cover a more comprehensive list of data blending techniques that you can do in Python (or SQL if you prefer it).
Let’s explore some practical SEO applications.
Overall approach
In order to blend separate data tables (think spreadsheets in Excel), you need one or more columns that they need to have in common. For example, we could match the column ga:landingPagePath in a Google Analytics table with the page column in a Google Search Console table.
When we combine data tables this way, we have several options to compute the resulting table.
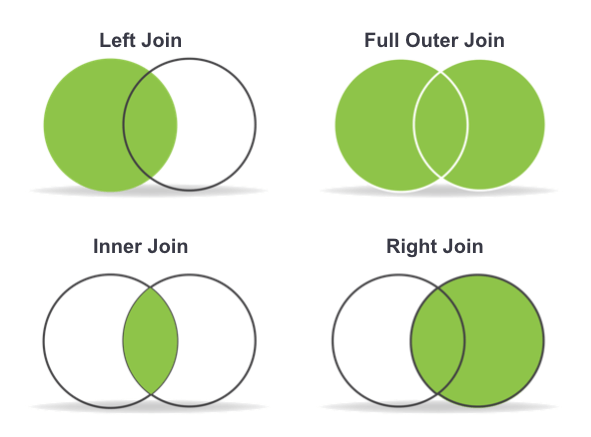
The Venn diagrams above illustrate standard set theory used to represent the membership of elements in the resulting set. Let’s discuss each example:
Full Outer Join: The elements in the resulting set include the union of all the elements in the source sets. All elements from both sides of the join are included, with joined information if they share a key, and blanks otherwise.
Inner Join: The elements in the resulting set include the intersection of all elements in the source sets. Only elements that share a key on both sides are included.
Left (Outer) Join: The elements in the resulting set include the intersection of all elements in the source sets and the elements only present in the first set. All elements on the left hand side are present, with additional joined information only if a key is shared with the right hand side.
Right (Outer) Join: The elements in the resulting set include the intersection of all elements in the source sets and the elements only present in the second set. All elements on the right hand side are present, with additional joined information only if a key is shared with the left hand side.
I’ll walk through an example of these joins below, but this topic is easier to learn by doing. Feel free to practice with this interactive tutorial.
Here are some practical SEO data blending use cases:
Adding conversion/revenue data to Google Search Console
Google Search Console is my must have tool for technical SEO, but like me, you are probably frustrated that you can’t have revenue or conversion data in the reports. This is relatively easy to fix for landing pages by blending data from Google Analytics.
Both data tables must use the same date range.
First, we’ll set up a Pandas DataFrame with some example Google Analytics data and call it df_a.
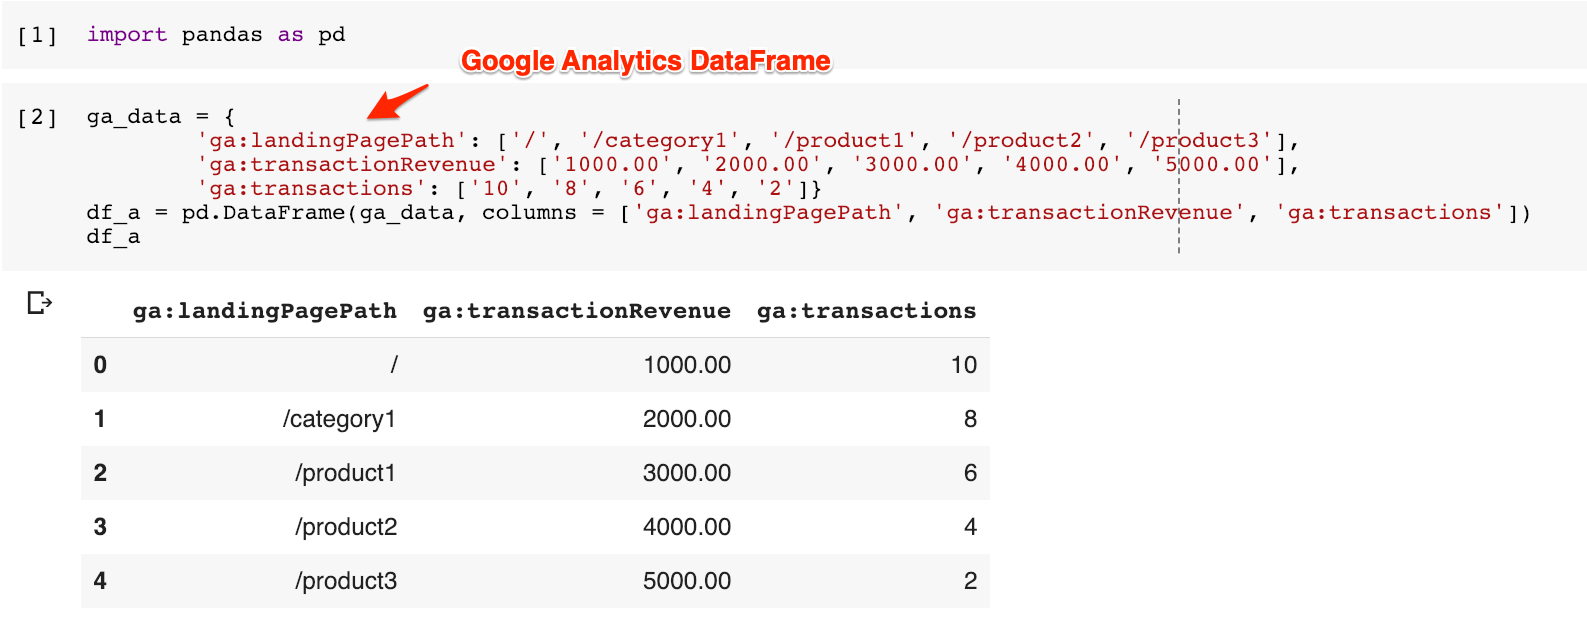
Google Analytics data table containing ga:landingPagePath, ga:revenue, ga:transactions (filtered to google organic search traffic)
Next, we’ll set up a DataFrame with some example Search Console data and call it df_b.
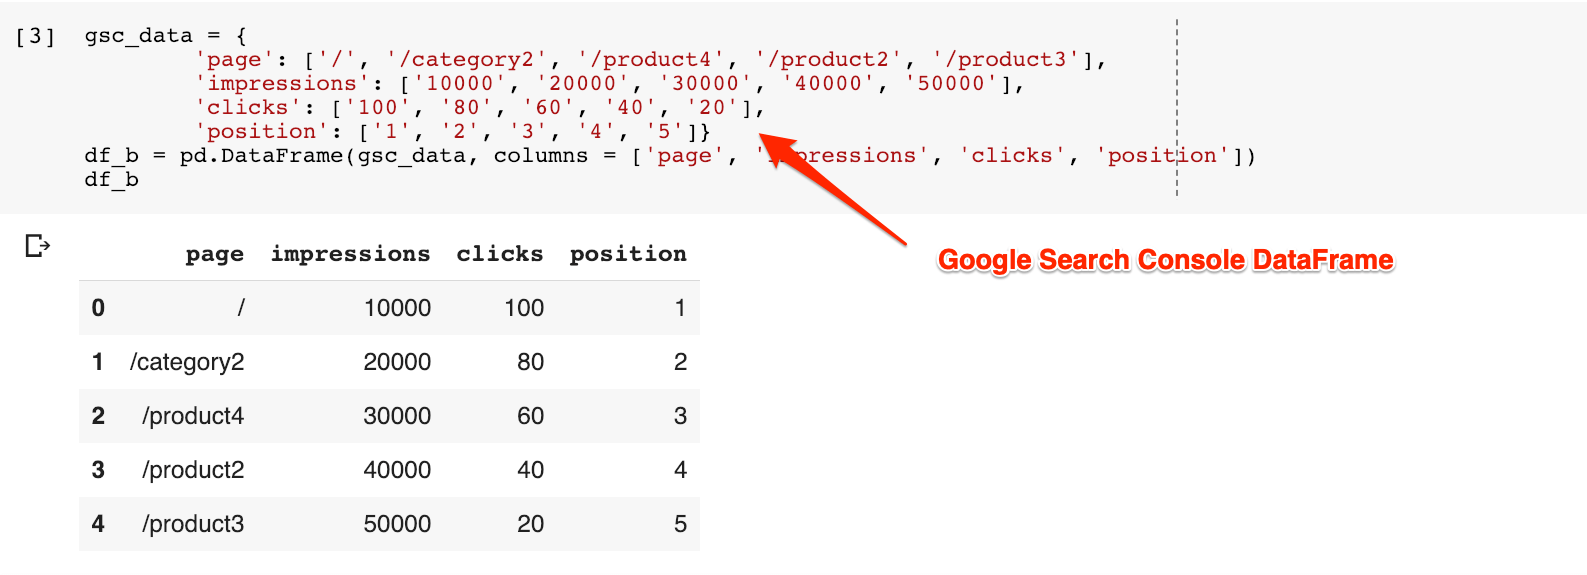
Google Search Console data table containing page, impressions, clicks, position
Now, we’ll use the Pandas merge function to combine the two, using first an inner join (the intersection of the two sets), and then using an outer join (the union).
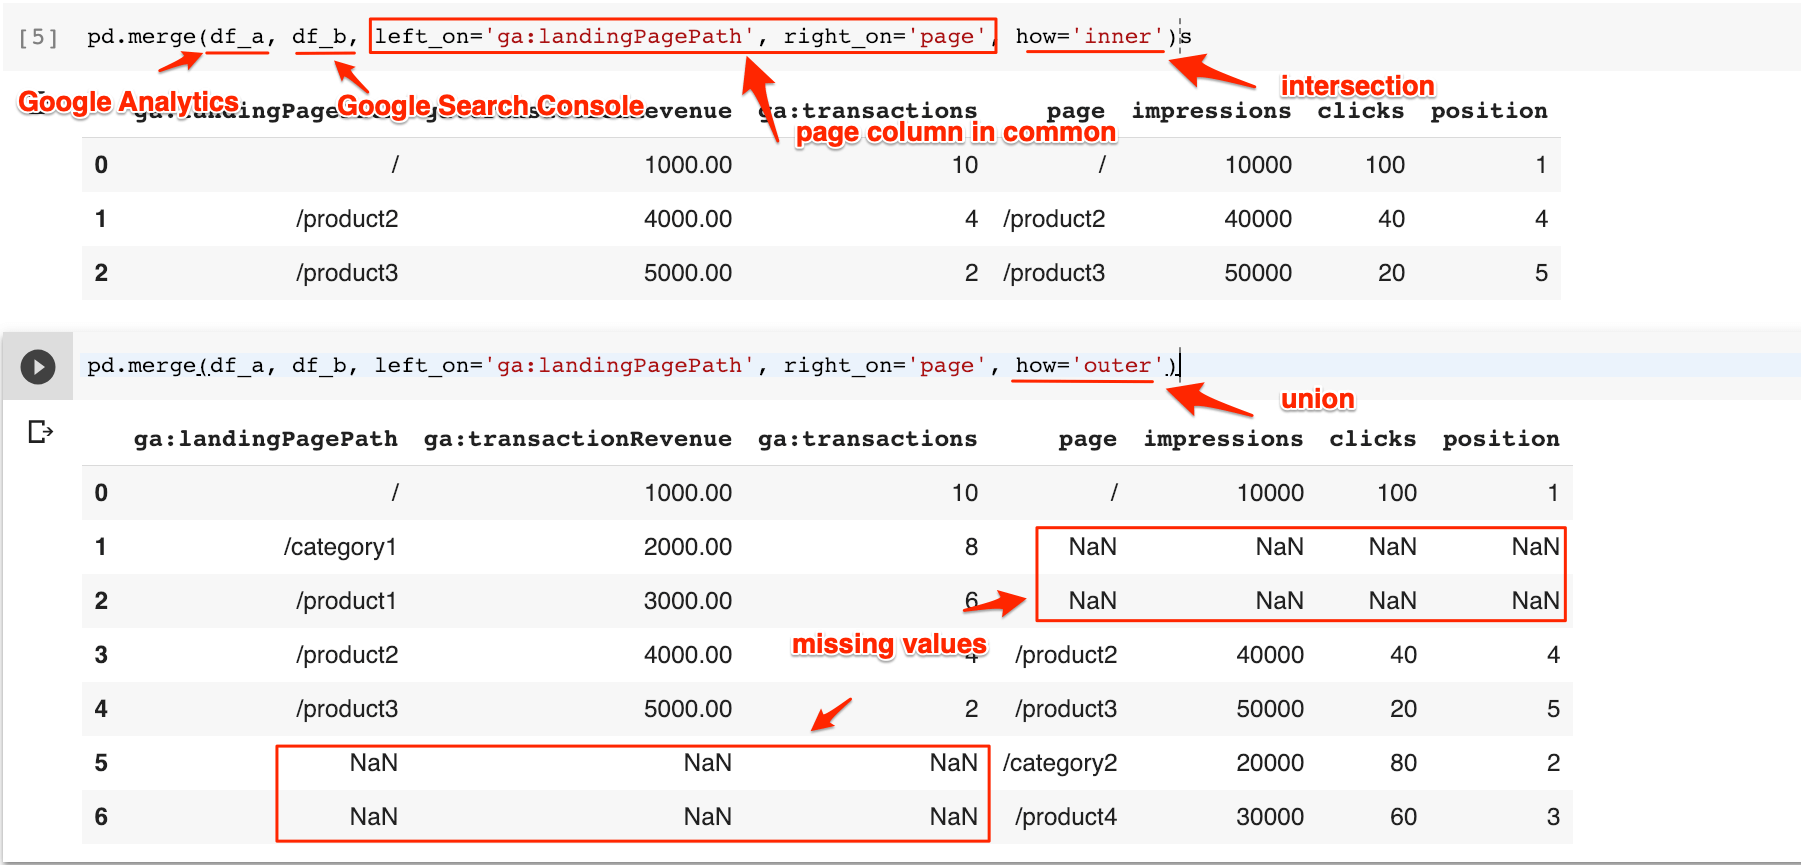
You can see that the outer, left, and right joins contain missing data (“NaN”) when no key is shared by the other side.
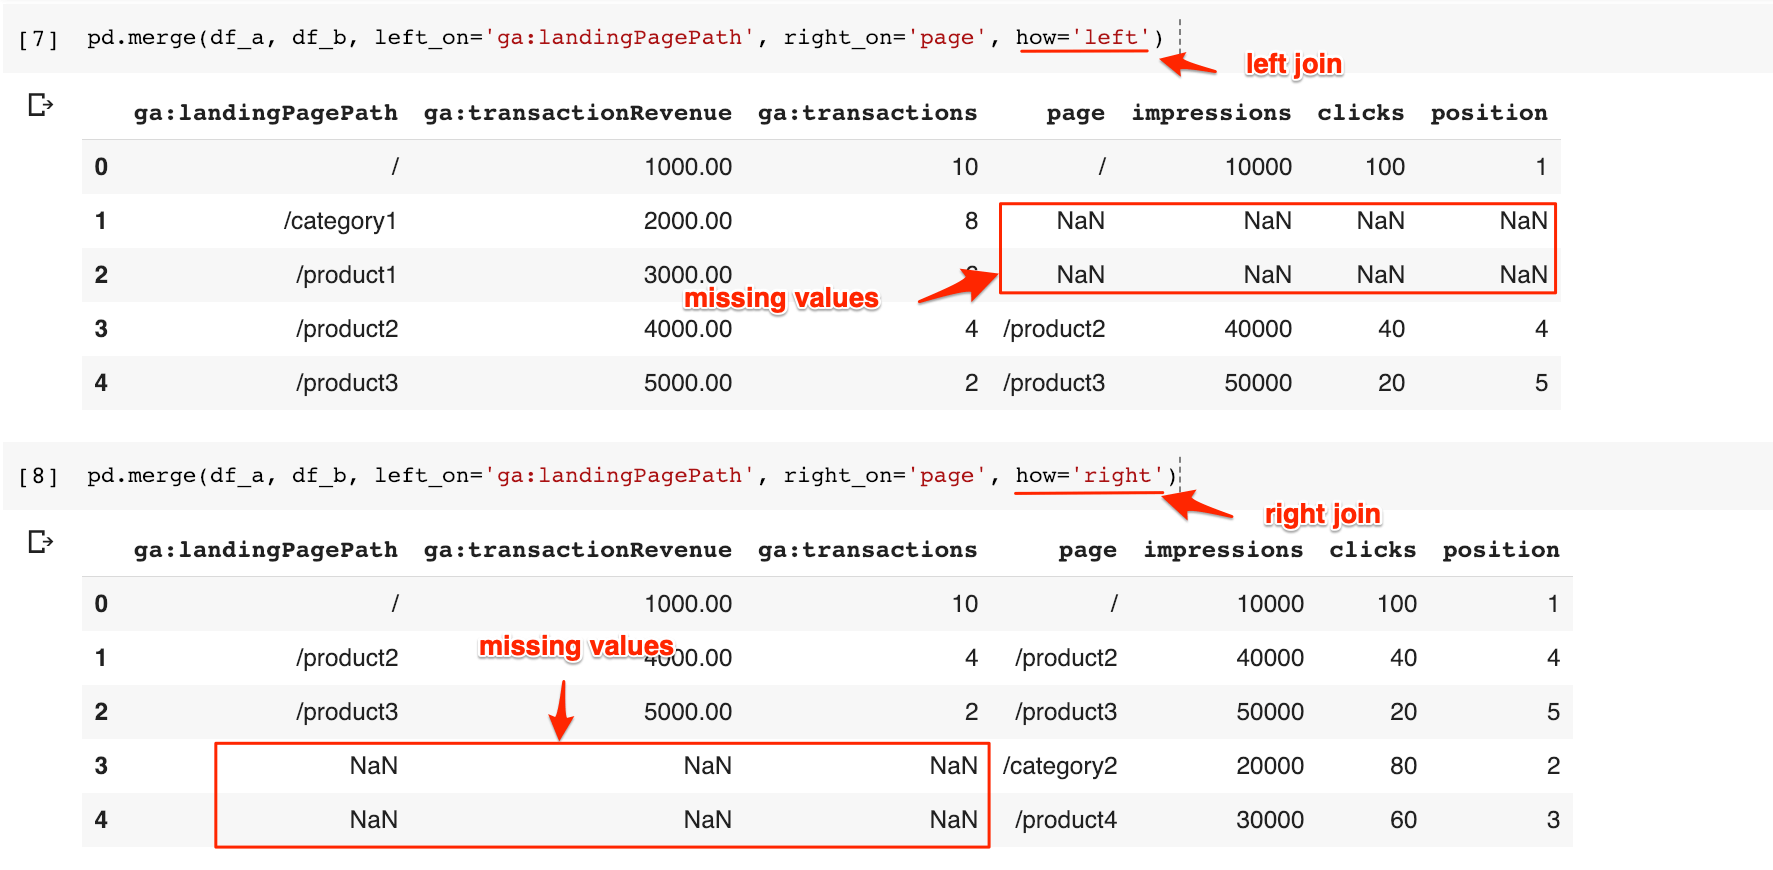
You can now divide transactions by clicks to get the conversion rate per landing page, and the revenue per transaction to get the average order value.
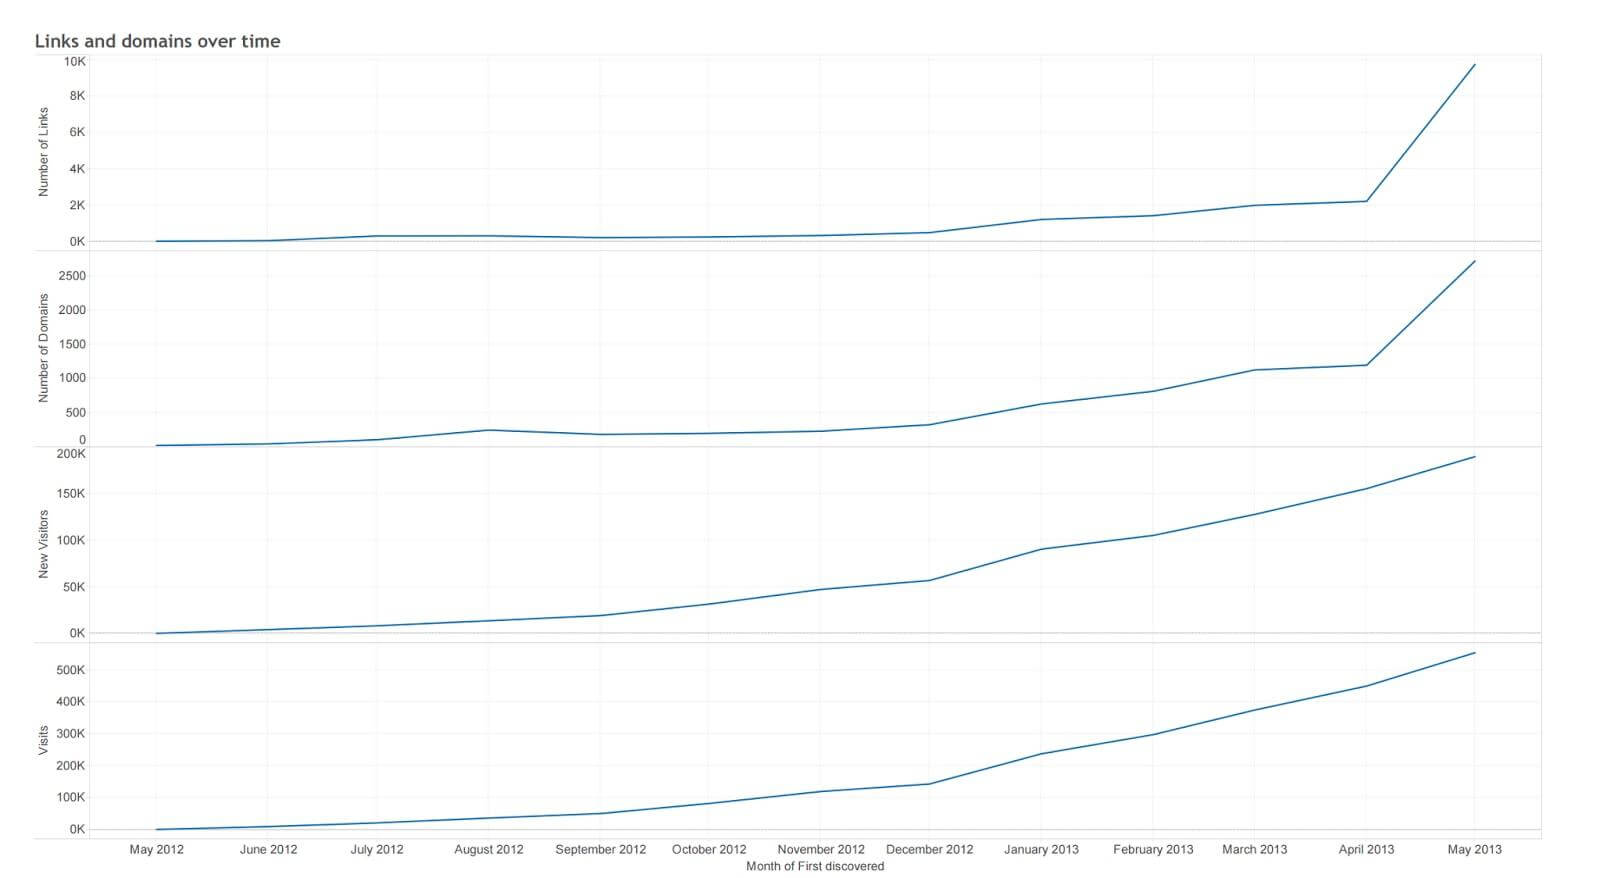
Correlating links and domains over time with traffic increase
Are increasing backlinks responsible for an increase in traffic or not? You can export the latest links from Google Search Console (which include the last time Googlebot crawled them), then combine this data table with Google Analytics organic search traffic during the same time frame.
Similar to the first example, both data tables must use the same date range.

Here is the data you’ll need:
Google Search Console: Linking page, Last crawled
Google Analytics: ga:date, ga:newUsers
Common columns (for the merge function): left_on: Last crawled, right_on: ga:date
You can plot traffic and links over time. Optionally, you can add a calculated domain column to the Search Console data table. This will allow you to plot linking domains by traffic.
Correlating new user visits to content length
What is the optimal length of your content articles? Instead of offering rule-of-thumb answers, you can actually calculate this per client. We will combine a data table from your favorite crawler with performance data from Google Analytics or Google Search Console. The idea is to group pages by their word count, and check which groups get the most organic search visits.
Both data tables must use the same set of landing pages.
Screaming Frog crawl: Address, Word count
Google Analytics: ga:landingPagePath, ga:newUsers
Common columns: left_on:Address, right_on: ga:landingPagePath
You need to create Word count bins, group by bins and then plot the traffic per bin.

Narrowing down the pages that lost (or gained) traffic
Why did the traffic drop (or increase)? This is a common and sometimes painful question to answer. We can learn which specific pages lost (or gained) traffic by combining data tables from two separate time periods.
Both data tables must use the same number of days before and after the drop (or increase).
First period in Google Analytics: ga:landingPagePath, ga:newUsers
Second period in Google Analytics: ga:landingPagePath , ga:newUsers
Common columns: left_on:ga:landingPagePath, right_on: ga:landingPagePath
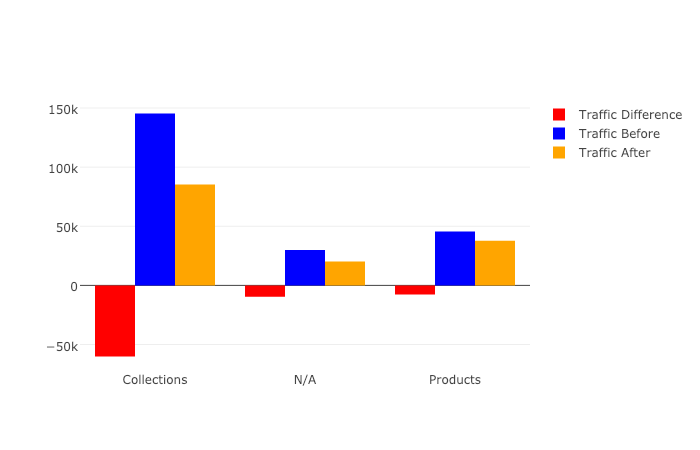
We first need to aggregate new users by page and subtract the first period from the second one. Let’s call this subtraction delta. If delta is greater than zero the page gained traffic, if it is less than zero lost traffic, and if it is zero didn’t change.
Here is an example where we have grouped pages by the page type (Collections, Products, or N/A) and calculated the delta before and after a drop in traffic.
Finding high-converting paid search keywords with poor SEO rankings
Do you have high-converting keywords in Adwords that are ranking poorly in organic search? You can find out by combining Google Adwords data with Google Search Console.
Both data tables must use the same date range.
Google Analytics: ga:adMatchedQuery, ga:transactions (filtered by transactions greater than zero)
Google Search Console: query, position, clicks (filtered by keywords with position greater than 10)
Common columns: left_on: ga:adMatchedQuery, right_on: query
The result will list low ranking organic keywords with transactions, positions and clicks columns.
Opinions expressed in this article are those of the guest author and not necessarily Search Engine Land. Staff authors are listed here.
Related stories
About the author