A Beyond Average Look At Search Ad Position
Among the scores of data points search marketers have at their disposal, perhaps no other metric is as shrouded by mythology and misconception as ad position. Despite careful studies showing, including one by RKG in 2006, and confirmation by Google in 2009 that conversion performance doesn’t vary much by position, you will still hear pronouncements, […]
Among the scores of data points search marketers have at their disposal, perhaps no other metric is as shrouded by mythology and misconception as ad position.
Despite careful studies showing, including one by RKG in 2006, and confirmation by Google in 2009 that conversion performance doesn’t vary much by position, you will still hear pronouncements, even among enterprise level practitioners, that some specific position on the page generates exceptional performance. This piece is not meant to rehash that argument, per se.
Instead, we’ll examine how attributes of the current ad auction including: a Quality Score calculated at auction, broad matching, dayparting, increasingly personalized results, local competition and a changing competitive landscape, all conspire to scatter an ad across the listings regardless of anyone’s best efforts to “own” a particular position.
The Ambiguity Of Average Position
Up until about a year ago, when Google introduced a ValueTrack parameter to pass along position for each ad click, this analysis wasn’t easy to do at scale.
Those using Google Analytics have had a limited view of click position for some time, but for others, short of scraping the SERP, which may or may not have been above board, the best view of ad position was previously Google’s impression-based Average Position, usually viewed at the daily level.
While the name itself clearly highlights it is just an average, and thus our ad may appear across multiple positions, it offers no insight on the extent to which that is occurring.
For example, if an ad has an Average Position of 3.5, did it appear 50% of the time in position 3 and 50% of the time in position 4? Or, did it appear in positions 2 through 5 25% of the time each.
Furthermore, Google’s Average Position tells us nothing about which positions actually drove traffic to our site. For that, we’ll need to assess the click position data we have via the ValueTrack parameter.
Actual Click Position vs. Daily Average (Impression) Position
Our sample here consists of over 120K ad clicks that took place over the course of a single day on about 50K unique keyword instances, i.e., identical keyword phrases in different ad groups or with otherwise different settings are viewed as separate from one another.
To keep the chart below readable, we’ve rounded the daily average impression position to the nearest integer. We’ve also grouped anything over position 10 in one bucket for both the click position and the average position. This includes any clicks from ads appearing on page 2 or higher.
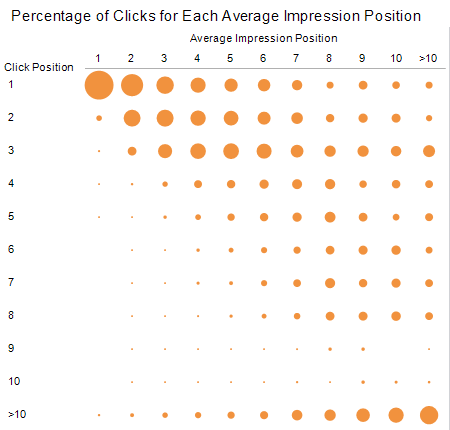
The size of each circle here represents the percentage of all clicks for that daily average position that occurred at the given click position. Or, the same data in table form:
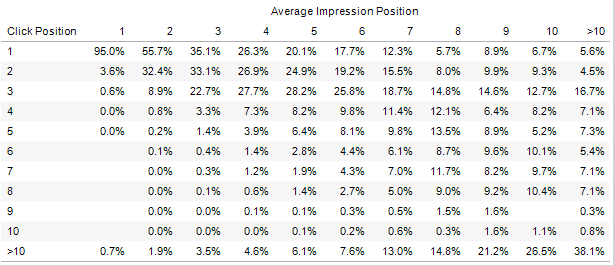
So, for ads with an average position of 1, 95% of clicks happened when the ad actually appeared in position 1, 3.6% happened when the ad appeared in position 2 and a small percentage of clicks occurred in lower positions.
A number of interesting elements jump out here, including:
- First and foremost, it’s clear that ad clicks really are taking place across a wide array of positions regardless of the average daily impression position. The spread escalates the lower the average position is, but is apparent throughout.
- Except for in position 1, most clicks do not take place at the same position as the average impression position.
- Click position is shifted upward from the average impression position. This makes intuitive sense as click-through rates increase as we move up the listings.
- We see a relative peak in clicks at position 3 and a relative drop off at position 9. The former likely has to do with ads moving from the side listings to the top of the page at that point. The latter may be a function of appearing below the fold.
- It isn’t until we get to an average position of 4, that the top position doesn’t generate a plurality of clicks.
Limiting Variables – Google.com & Exact Match Only
To get a sense of the extent to which broad match and the Search Network may be skewing these results, let’s take them out of the equation by looking only at keywords that are restricted to exact match and to showing on Google.com.
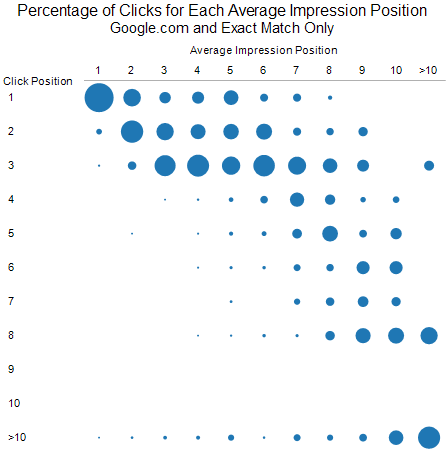
We can see that the degree of dispersion has been reduced, but it is still evident and some interesting nuances remain. Clicks are more likely to occur in positions closer to the average impression position, but the position 3 peak is even more prominent.
We also see exactly zero clicks from ads showing in position 9 or 10.
Search Network Position vs. Google.com Position
So, some combination of Search Network impressions and broad matching appear to introduce a great deal of variability in the positions that generate clicks.
Comparing average click position at each average impression position for clicks on the Search Network to those on Google.com, we can see how the first factor affects these figures:
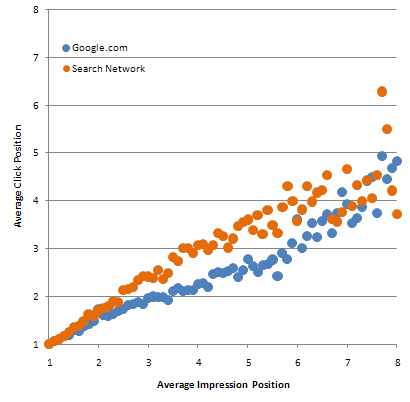
For virtually every average impression position, a click from the Search Network is likely to take place at a lower position on the page than a click on the Google.com domain.
This gap becomes more prominent for average impression positions between 3 and 6, helping to explain the differences between the first two charts above.
Because Search Network traffic generally performs more poorly than that from Google.com, how clicks are split between the two at any given average position, may impact overall conversion rates for a keyword. This effect likely contributes to the notions that certain positions are considerably more valuable than others.

Here we see that the percentage of clicks from the Search Network actually runs lower at top positions on the page and increases consistently to about position 5 before the trend diffuses. This may seem counterintuitive since we expect to be more likely to get picked up on the Network the higher our position.
While the keyword mix could be a factor here, it’s likely that the click-through rate bump we see for higher positions is stronger on Google.com than the Network. This is consistent with the data above showing that Search Network clicks are likely to take place farther down the page at any given average impression position.
Match Type Effects Or Lack Thereof
Somewhat surprisingly, the average click positions of broad matches and exact matches at any average impression position tend to track very closely to one another:
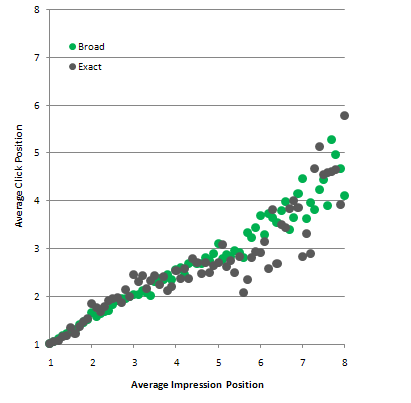
Like Search Network clicks, broad matched clicks tend to perform worse than average. This is because our keyword is not as closely tied to the user’s search and intent as an exactly matched query.
With broad match, we are qualifying for many additional auctions and we might expect more of a bias in how that manifests itself here.
Takeaways
Hopefully this piece has made it clear that search ad position is in a state of flux, even when we account for the larger factors within our control.
SERP personalization and an ever-changing competitive landscape make it impossible to appear in a specific, “optimal” position (even if one existed) anywhere close to 100% of the time. That is, unless you’re willing to pay huge bucks for position 1, in which case Google will gladly take your cash and you may have better luck.
The result of all of this is that the bid to click curve is continuous, just as it appears in any Google Bid Simulator graph. When we increase our bid, we’re not jumping from one position to the next, we’re really changing the distribution where our ads may appear.
Lastly, and maybe this should go without saying, but this data is by no means an encouragement to bid up to position 1 because that’s where so many clicks happen. If you’ve gotten this far and still have that impression, then I have failed.
Opinions expressed in this article are those of the guest author and not necessarily Search Engine Land. Staff authors are listed here.
Related stories
About the author