Analyzing Cost-Per-Click Inflation In The Marketplace
In any pay-per-click auction environment (like paid search), the average cost-per-click (CPC) represents the result of a complex auction algorithm which includes multiple factors, such as: Competitiveness level Quality Score Bidding strategy Seasonality In a previous post, I approached the competitiveness piece by looking at the ratio between the CPC and max bid in order […]
 In any pay-per-click auction environment (like paid search), the average cost-per-click (CPC) represents the result of a complex auction algorithm which includes multiple factors, such as:
- Competitiveness level
- Quality Score
- Bidding strategy
- Seasonality
In a previous post, I approached the competitiveness piece by looking at the ratio between the CPC and max bid in order to identify where the competition is low or high — which works fine when looking at recent max bids and CPC data.
However, one would need at least one full year of max bids, Quality Score, and average position to really be able to understand not only the CPC evolution over time, but also the reason(s) why the CPC have gone down or up.
Are CPC changes due to a different bidding strategy? Have new competitors entered the market place? Has the Quality Score decreased, resulting in higher CPCs?
While it is difficult to answer all those questions individually, a workaround to determine the “true” marketing cost evolution is to simulate the average cost per click for a stable ad position – which I’ll refer to as the “normalized CPC” in this post.
Average Vs. Normalized CPC
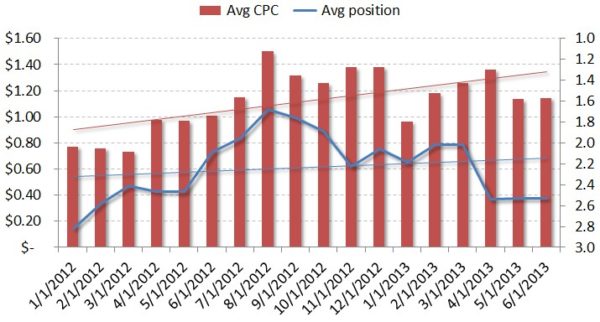
For the sake of this analysis, I’m going to compare the average CPC evolution (at various ranks) with the normalized CPC (at stable ranks). The below chart shows the average CPC and position from January 2012 to June 2013 for a significant subset of the eSearchVision client set. The graph indicates that the average CPC has been steadily increasing — from $0.77 in position 2.8 in January 2012 to $1.15 in position 2.5 in June 2013.
To adjust for seasonal trends, we can look at the year-over-year data for each individual month. For example, the June CPC has increased from $1.01 at position 2.1 in 2012 to $1.15 in position 2.5 in 2013 — indicating that the average CPC increased by 13% while the average ad position was worse by 0.4 year over year.
Now, we can use statistics to dive into the actual cost per click changes at stable positions. To determine those normalized CPCs, we’ll use an exponential regression type to analyze the relationship between CPC and position based of nearly two years of daily data. You can use the following formulas in Excel:
CPC = c * EXP (b * Position)
where c= EXP(INDEX(LINEST(LN(CPC_Range),Position_Range),1,2))
and b=INDEX(LINEST(LN(CPC_Range),Position_Range),1)
Note that “CPC_Range” and “Position_Range” respectively refer to the daily CPCs and positions in Excel. See the below example, which looks at June 2012 data:
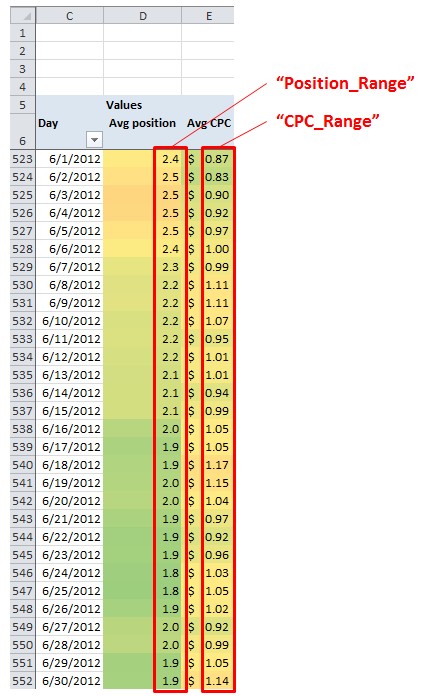
So, applying our formulas to the chart above, we get the following values:
c= EXP(INDEX(LINEST(LN(E523:E552),D523:D552),1,2)) =1.48
b= INDEX(LINEST(LN(E523:E552),D523:D552),1) =-0.18
Hence, CPC= 1.48 * EXP(-0.18*Position), which can used for multiple position values, such as 1.0, 2.0, 3.0, 4.0, and 5.0. You can apply the same logic to all months in your data set until you get all normalized CPCs. For instance, you can take a look at the normalized CPC evolution over time as shown in the below graph:
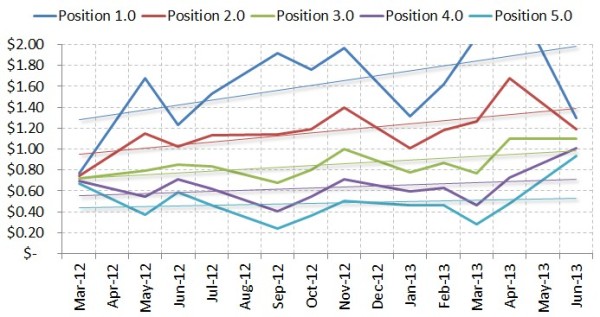
In an attempt to get more granular, you can focus on specific months and determine the year over year trend at stable positions. Looking at June 2012 vs. 2013, position 1.0 costs 5% more, while position 5.0 costs 58% more, which indicates an increased competition in positions 4.0/5.0.

Conclusion
Analyzing normalized CPCs instead of just average CPCs helps get closer to the “true” CPC inflation in the marketplace and potentially anticipate future trends. Also, a side finding is that CPC inflation varies with position, as opposed to a flat inflation across all positions. This can definitely be leveraged from a bidding strategy standpoint in order to stay away from high- inflation slots, and bidding more aggressively where inflation is less of an issue.
Opinions expressed in this article are those of the guest author and not necessarily Search Engine Land. Staff authors are listed here.
Related stories
New on Search Engine Land
About the author