Data Analysis for SEO: Industry KPIs For A Mature Industry
As we move closer to the 20th anniversary of the launch of public search engines, a key industry trend in search marketing is the long called-for move to placing transparent, objective & measurable KPIs at the heart of search marketing, social & content campaigns. What KPIs give you an objective measure of your agency?
It was in the 1990s that Archie — generally considered to be the first Internet search engine — was written. But it wasn’t until WebCrawler and Lycos in 1994 that publicly accessible full-text search became generally available and spawned the demand for a search marketing industry.
As we approach the 20th anniversary of the launch of those search engines, a key industry trend in search marketing is the long called-for move to placing transparent, objective and measurable KPIs at the heart of search, social and content marketing campaigns.
Witness the rollout of campaign ROI analysis, attribution modeling and then social campaign engagement metrics in Google Analytics (GA) over the last twelve months — all the result of customer demand.
Industry KPIs
For some time now, I’ve been banging the drum for transparency in digital marketing performance metrics, and I welcome the shift toward an industry standard measure of performance in each online marketing channel.
Imagine the value of an objective list of top-performing agencies based upon an agreed set of standard KPIs rather than the current glut of lists ranking by revenue (skewing the results wildly towards agencies passing high PPC campaign spends through their books).
Some of the metrics I’d love to see used as industry standards are as follows:
- Year-over-year (YOY) growth for non-branded organic traffic and revenue,* corrected for “not provided”** and viewed in the context of overall traffic growth. (Measuring YOY growth is a good way to adjust for seasonality as it eliminates the impact of industry trends and general brand growth.)
- YOY click-through rate (CTR) improvement from the SERPs, split by branded and generic search queries.
- Month-Over-Month (MOM) backlink growth archived and trended over course of campaign and normalised for disavowal activity undertaken at the start of campaign.
- YOY PPC Cost, Clicks, CTR, Transactions, CPA and Revenue, split by branded and generic terms. (This information should be available at the campaign and ad-group levels.)
- Campaign-level reports for Email, Affiliates, Display and Social channels showing: Spend, Open Rate, Impressions, CTR***, Clicks, Bounce Rate, Attributed Revenue, ROI.
- MOM/YOY landing page bounce & conversion rate, segmented by channel and split by branded and generic terms where appropriate.
- MOM/YOY conversions to the start of the checkout funnel (again, split by branded and generic for appropriate channels).
- MOM/YOY funnel conversion and exit pages (split by branded and generic for appropriate channels).
- Total reported conversion issues based on customer feedback (expressed as a percentage of the overall conversion rate), segmented by issue type, channel and funnel as required based on site complexity.
- YOY Lifetime Value (split by branded and generic for appropriate channels).
* Revenue should always be tracked, even for non-transactional websites which should go through a value estimation process to establish a “value per enquiry” or similar metric which is then applied to goal tracking and funnel processes on the site.
** The correction is calculated by taking a trend of brand growth month-over-month and applying the factor to attribute “not provided” to brand and generic appropriately. This is a “thumb in the air calculation,” but at least normalises sufficiently to allow rational decisions to be made from the resulting data.
*** Where not given naturally for the channel, can be calculated (for example, a social campaign can use engagement metrics to calculate an equivalent CTR).
Comparative Metrics For Industry Transparency
While there are plenty of more actionable metrics that could be added to this list, the purpose is to try to establish metrics that can be comparative across agencies to enable industry transparency.
While we all live in the real world and regularly walk into a new campaign with sub-par existing analytics implementation in place, it’s certainly possible to run on MOM metrics for the first year after auditing and implementing accurate tracking with a view to second year YOY comparison — the point is to set an accurate baseline.
And, just for the record: even if you don’t have e-commerce or goal tracking metrics set up and full year data, everyone can filter out non-brand organic traffic, trend it over time and compare to the previous year’s performance with an adjustment factor if required for a super-simple, objective agency performance metric.
Why Should We Care?
Because businesses are finally waking up to the fact that data is an enabling tool to let them make better business decisions and reward the best performing agencies with more clients. Consider the graphic below, recently highlighted by Forrester.
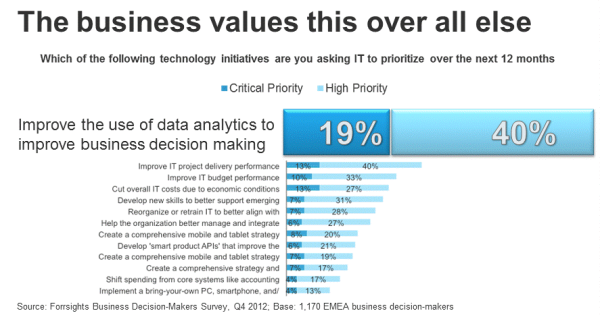
Big business decision makers are more comfortable applying data analysis to vet their agencies’ search marketing performance.
My list of KPIs is not exhaustive — what metrics would you like to see introduced to an industry-wide set of search marketing benchmarks?
Opinions expressed in this article are those of the guest author and not necessarily Search Engine Land. Staff authors are listed here.
Related stories
New on Search Engine Land
About the author