Does Booming International Search Mask A Google Decline?
Google’s recent quarterly financial statements sounded pretty rosy overall. Many have much to celebrate in the figures. Stockbrokers and city analysts were much more worried about Google’s cunning share split. I haven’t seen a single commentator consider the US versus the rest of the world. Well, here it is! Let’s take the raw sales performance […]
Google’s recent quarterly financial statements sounded pretty rosy overall. Many have much to celebrate in the figures. Stockbrokers and city analysts were much more worried about Google’s cunning share split. I haven’t seen a single commentator consider the US versus the rest of the world. Well, here it is!
Let’s take the raw sales performance first. Below is a chart which looks at the rate of growth of the US, UK and then the rest of the world. You can see that the dramatic peak of two quarters ago (mainly from the international markets) has disappeared and things have returned to steady growth rates around the 30% year on year level.
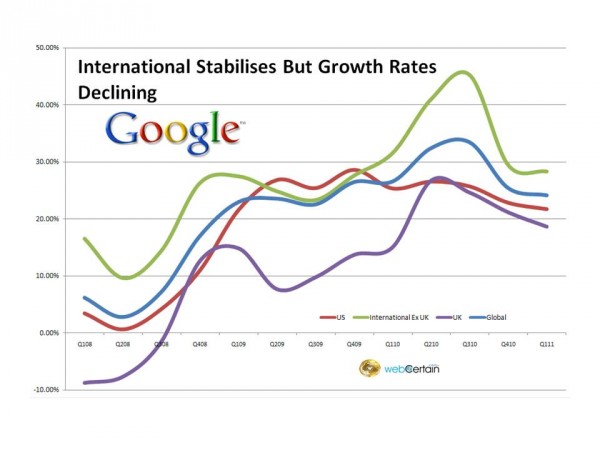
International Stabilises But Growth Rates Declining
A 30% growth rate is great in anyone’s book — but we tend to forget that this isn’t just a Google figure, this is a reflection of growth in the market as traditional forms of advertising fade on the vine and online takes off. Google has done a lot to help it along, but the market has generally been going dramatically in that direction.
As the chart below shows, the market for search outside the US and UK now exceeds at least $23 billion.
Google has at least 80% of that, which we’ll dig into in a few moments, but the two biggest global competitors (non-US, non-UK) are Baidu and Yandex who between them earn around 16% of the total market share.
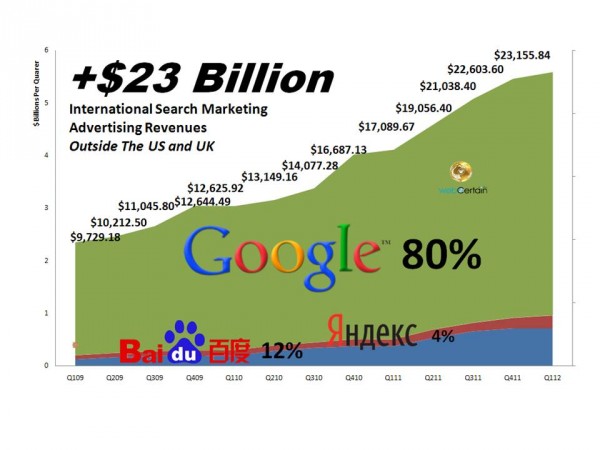
The Global Search Market Outside The US And UK
The last two quarters of more “muted” growth have seen the huge rate of increase in spending from Google on people and advertising dipping also. Which was the chicken and which was the egg? I guess we’ll never know the answer to that.
What we can say is that the Larry Page inspired shift upwards in gears, has settled, albeit at a higher level. The spend on advertising and staff hasn’t abated, it just hasn’t accelerated to the same degree it did last year.

Google Growth Rates In Headcount & Sales Dramatically Slow
One feature of Google’s last quarter’s report was a drop in the value of clicks at the same time as the number of clicks increased. The Web conference to explain the company’s financial performance this quarter pointed much more at clicks in the mobile sector being part of the cause.
Thanks to the huge rise in Android and a strong increase in mobile advertising, Google has seen a significant rise in the number of mobile clicks on its ads.
The problem is, the value of the resulting clicks is much lower as the chart below seems to show. In fact, the average cost of a click now is less than it was in 2008, according to Google’s own figures extrapolated in the chart.
This is good news for advertisers for sure, but does mean if that’s not the pattern you’re seeing, you may need to think about which types of ad to buy? Might this be a time to consider adding mobile to your portfolio of activity?

Average Value Per Google Click Drops To 2008 Levels
If we correlate the clicks volume to rising revenue divided by the US, International and the rest of the world, if you check out the trends in the red circle below, it does seem that click volume might be putting revenues under pressure.
US revenue is following its normal cyclical pattern of a decline in the first quarter of the year, but looking behind the figures, this decline is actually slightly more than usual.
Mobile ads, and the US decline might all be linked to the lower value of clicks.

Regional Revenues Correlated To Click Volumes
Perhaps more influential on the Google’s psyche and strategy is the concept of a falling global market share outside the US and UK. Our figures show that from quarter 1 2009 to now, Google may have lost as much as 8% market share.
This doesn’t mean that Google isn’t getting people to use it or to use search, but it might mean there’s much more competition for online marketing bucks than there was just a couple of years ago.
These figures are based on publicly declared reports, but they are nonetheless difficult to calculate as all businesses have multiple sources of revenue.
However, just suppose that Google was looking at a similar pattern internally, how would you change your strategy?
I think you’d try spending more on advertising, recruit more people to push the Google message home, focus only those developments that could help take your business forwards competitively and you’d try launching products that trod on the toes of your budget stealing competitors (Facebook?) — namely something like Google+.
Does this sound familiar? Oh this might be a good time to change the share structure to protect your control for the future too — while you still can!

Google Global Market Share Outside UK And US - Estimated
Opinions expressed in this article are those of the guest author and not necessarily Search Engine Land. Staff authors are listed here.
Related stories
About the author