Figure Out What Is Important, Then Measure It
As search marketers, we are constantly digging around in analytics, finding data, thinking it looks neat, then stepping back and saying, “But is this important?” I’ve done this a million times, and recently came across a quote that put some of what I’m always looking for into perspective. Don’t make the measurable things important but […]

As search marketers, we are constantly digging around in analytics, finding data, thinking it looks neat, then stepping back and saying, “But is this important?”
I’ve done this a million times, and recently came across a quote that put some of what I’m always looking for into perspective.
Don’t make the measurable things important but make the important things measurable.
The data you have is not necessarily the data you need to succeed. I think we go about this all wrong sometimes. Instead of finding data in Google Analytics or some other tracking program and trying to figure out if it’s significant, we need to step back to our business goals and KPIs and then figure out how to measure those important things within the platform we choose.
Without the perspective of importance, it’s very easy to be mired down in data paralysis, with so many numbers, words, statistics, and percentages flying at us, we just don’t know what to do next.
Much of what I do as an agency employee is based on the ultimate goals of my clients. They need to tell me what those are. I can make goals for their online marketing project, but if my online marketing goals don’t align with their business goals, we’re working at odds instead of as partners.
Ultimately, I’m here to help clients achieve their business goals, so we have to work together.
What Is Important?
This is a question I just can’t answer; I have no idea what is important to your business. Likely a goal is to be profitable, below that goal will be Key Performance Indicators (KPIs) that contain actions that are likely to help you achieve your goals.
When we get into the action items, and the KPIs, then we can talk about what you need to measure to ensure you’re moving in the right direction.
Let’s set some KPIs to use as an example. In this case, the company we’re working with wants to:
- Increase the engagement a user has with their site by increasing time on page, page views per unique visitor, and decreasing bounce rate
- Know when the Paid Advertising budget is being used to its most efficient levels and adjust day parting to ensure there is ample budget for the busiest parts of the day
- Understand what days are heavy shopping days and make nimble changes to increase shopping on less busy days
These are various KPIs that might fall under different company goals, and are strictly for example purposes. What we have created is a list of what is important to the client. Now we need to know how to measure these important indicators.
How Do We Measure It?
We have the “important” part, now how do we measure it. I’m a big believer of not recreating the wheel if we don’t have to.
Lots of amazing people in this industry work very hard to share what they learn. We can all benefit from this mentality, and I encourage everyone to give back to the group and share what you’ve learned. I take a few steps to see if there is something already existing I can use to measure my clients’ KPIs.
First, check out CustomReportSharing.com. This site features an amazing community of very smart people who share different types of reports they’ve come up with. I found reports here to help us understand 2 of our 3 KPIs above.
- The Page Efficiency Analysis Report was built by Avinash Kaushik and has been shared with the masses in a few places, the easiest way to find it is in the Custom Report Sharing site. This report will tell you how engaged your visitor is with your site (KPI #1 above) and includes the outcomes in the form of Goals. I put the updated link in the comments on this post, so be sure to click there instead of in the main post.
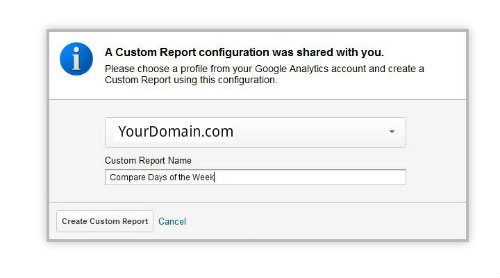
Within the Custom Report Sharing website there was a report shared to “Compare Days of the Week.” Unfortunately, it didn’t work in the newest version of Analytics, so I had to build one myself. This wasn’t 100% reinventing the wheel, I used the screenshots in the original report author’s post to recreate my Custom Report. They did the thinking, I did the clicking – and I created the following report in about 10 minutes.
- The Compare Days Of The Week report allows you to see Visits, Bounce Rate, Goal Conversions and Sales on your website across days of the week. View a full week of data and see which days receive the most sales. You’ll need to edit this report to add your Goal Setups as additional Metrics. Once you’ve done this, you’ll see this reports fulfills the data we need for KPI #3 above.
The links given to share reports are pretty straight-forward to use. Login to your Analytics account and then past the url into the browser. You’ll be given the option to add this report to any or all profiles on your account – and you can give the report it’s own name. This is an easy way to work once and use the report more than once.
We have 75% of our work done, and we didn’t need to reinvent the wheel, just balance and tweak it a bit. If I can’t find what I need at the CRS website, I start using our old friend Google to search for a solution, honestly someone has already figured these things out, it’s just a matter of them having shared their solution, and you finding it.
Luckily this industry is pretty good at making sure the stuff we write gets found. You can start by searching the Google Analytics help, and expand your search to all of Google if you don’t find anything useful there.
To fulfill our need to measure KPI #2 above, we need to look a little further. Previously, day parting was a tad easier to report on. The new version of Google Analytics made us have to do a little hoop-jumping to understand what’s going on. If you have a report you use, please share it below.
“Day Parting” is a term used by Google Analytics and Google AdWords to set or report the use of budget within Google AdWords. To find out when our budget is being exhausted, we need to do a little fancy footwork, but it is completely doable.
First, make sure your Analytics and AdWords are correctly connected. This is important – don’t skip this step.
Within Google Analytics, there is a section called “Advertising” and below that the heading “AdWords.” Once you click through AdWords, you’ll see the report called “Day Parts.”
This report shows you when your ads are being clicked on, and can show you when you’re running out of budget. You can couple this report with a Custom Alert within AdWords that notifies you when your budget is a certain percentage spent, and you will have an understanding of when your budget is disappearing.
The Day Parts report can show you what revenue and Goal Completions happen during which hours of the day. If you’re consistently getting a ton of clicks, but no conversions during specific hours of the day, you might consider either a) increasing your efforts to create conversions during those hours; or b) adjust your paid advertising spend down during those hours and concentrate those extra dollars during your highest converting times of day.
Either tactic is sound, depending upon your own business’ needs. You might not have staffing to handle sales during those hours, so why push conversions?
I’m not saying your work is done here. I’m an advocate of using data to create strategy, not just reporting facts that look to the past. We can see data that helps us understand how our KPIs are doing, but this doesn’t eliminate the need to interpret and plan more tasks and strategies to help our KPIs grow and our business prosper.
The benefit here is to look at what’s important before we start mucking around in analytics. Have a set of things you need to know, and then look for ways to measure them. You’ll set yourself up for success, and not spend hours distracted by numbers and percentages that don’t mean much to your bottom line.
Measuring Tape image courtesy chefranden on Flickr
Opinions expressed in this article are those of the guest author and not necessarily Search Engine Land. Staff authors are listed here.
Related stories
New on Search Engine Land
About the author