Google Search Console links AMP debugging to AMP page experience guide
Google made changes to how to debug some AMP URLs within Search Console.
Now when you are debugging some of your AMP pages within Google Search Console’s page experience report, Google will link you over to the AMP page experience guide for deeper analysis.
The company announced “today, we are excited to share that starting today Search Console will direct developers debugging AMP page experience issues to the AMP Page Experience Guide!”
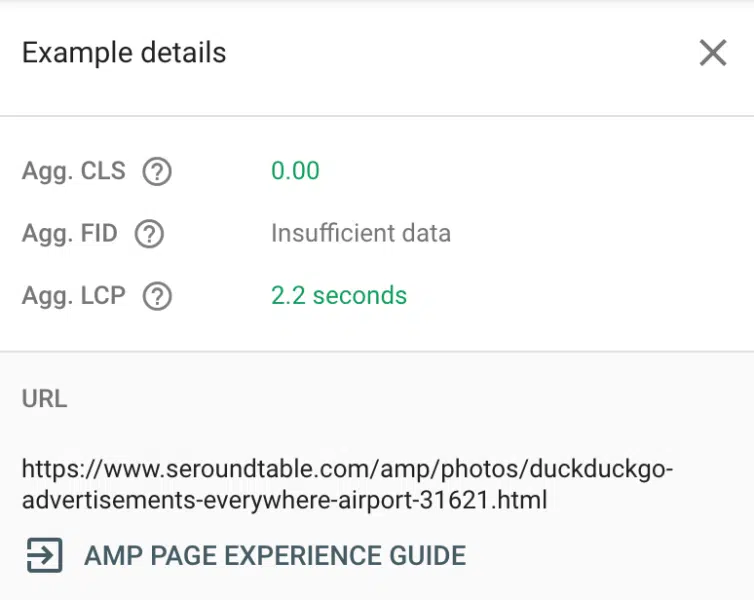
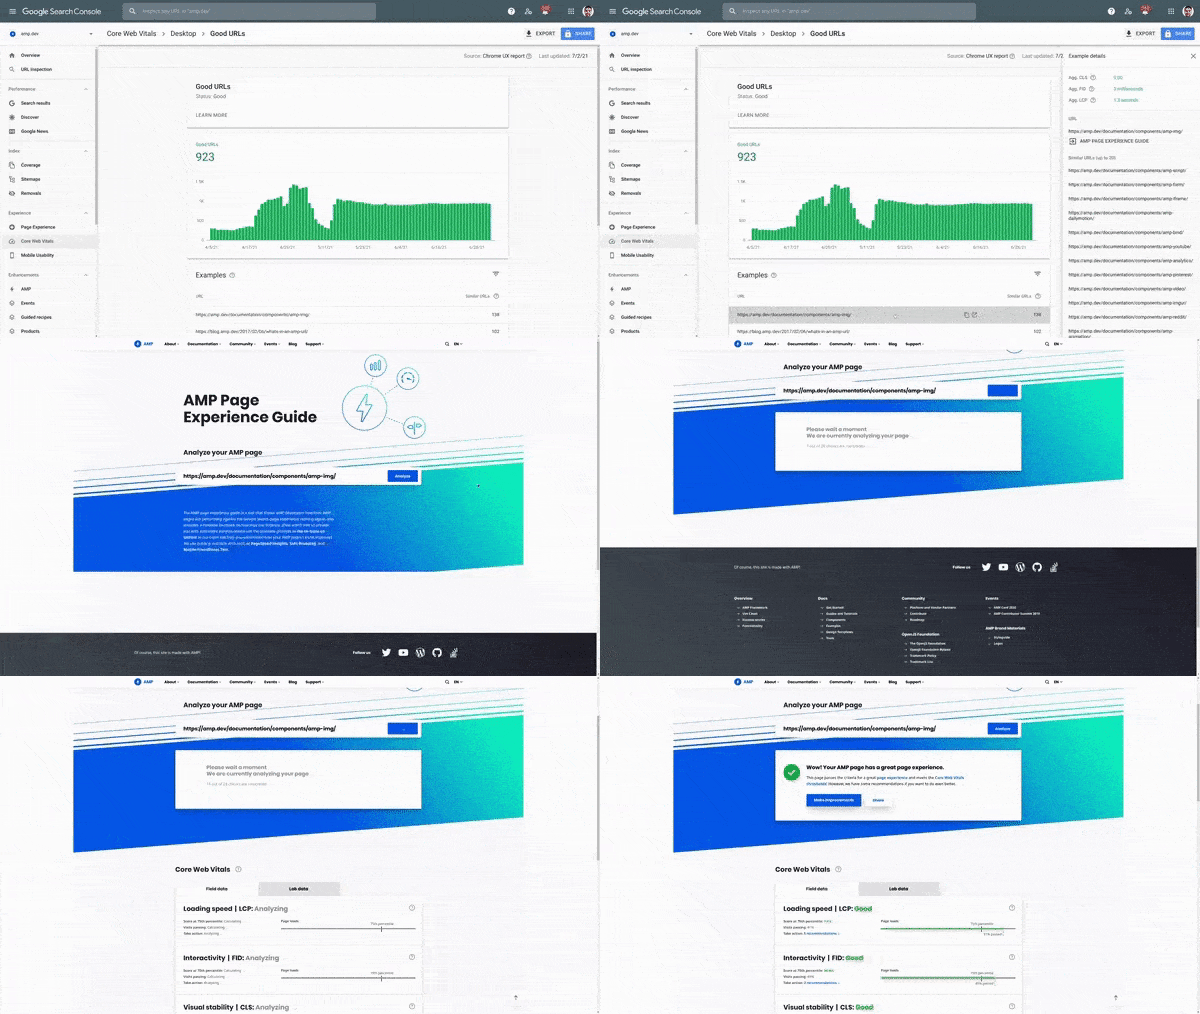
What it looks like. If you go to the page experience report in Google Search Console and then click on a specific AMP URL you want to analyze, Google will show you at the top right a link that opens in a new window to the “AMP page experience guide.”
Here is a sample screenshot:

Here is a GIF of it in action:

Why the change. Well, Google said “this new functionality will make it easier for you to act on performance issues reported by Search Console.”
Why we care. If you use Search Console to debug URLs and you debug a lot of AMP URLs, you may notice this change. So it is one extra click on some level to get to the details you need for debugging these URLs but I guess it gives Google one less place to manage AMP debugging.
Related stories