How SEOs can create a free server log dashboard to better understand incoming traffic to your website
This step-by-step guide will help SEOs harness powerful visualizations with log files utlizing free tools.
This technical SEO tutorial takes a step-by-step approach to create your free server logs dashboard using Elasticsearch.
This approach harnesses the power of Elasticsearch to help create powerful visualizations using your log files. These visualizations help webmasters understand incoming traffic to their website by using data that is completely reliable and unsampled.
And because it’s free, anyone can create this new dashboard to help SEOs gain a better understanding of technical SEO issues that might harm your website’s traffic.

A quick review of what you’ll need
To build this dashboard, you will need to download your server log files along with the ElasticSearch tools. You’ll also want to make sure you have the latest version of Java installed. The final steps include using Filebeat to interpret your logs before you send them to Elasticsearch. Kibana is used to visualize your dashboard.
What are server logs?
A web server log file is a file containing a record of all the requests that your server receives.
Anytime your server gets a “hit” from a user, from a bot or from another server, it logs information from the entity that requested files from your website and stores it in your server access logs.
It usually looks like this:
66.249.70.33 - - [31/Dec/2019:15:23:47 -0500] "GET /robots.txt HTTP/1.1" 301 705 "-" "Mozilla/5.0 (compatible; Googlebot/2.1; +https://www.google.com/bot.html)" - 66.249.70.33 – IP address that was used to Ping your servers.
- [31/Dec/2019:15:23:47 -0500] – Date and timestamp when your servers were hit;
- “GET /robots.txt HTTP/1.1” – Type of command used to ping your servers. It will be either
“GET”or“POST“. The/robots.txtpath is the URL that was pinged (in this case my robots.txt).HTTP/1.1is the version ofHTTPthat was accessed; 301is the response’s status code;- “compatible; Googlebot/2.1; +https://www.google.com/bot.html” Gives you more information on how accessed your servers. In this case, Googlebot.
Step 1: Download your logs files
To build the dashboard you will need to download your log files on your computer.
I will show you how you can get access to your log files using CPanel.
Alternatively, if you want you can also download this fake Apache log file.
Access your CPanel by logging into your web server host account.
Here are a few popular web hosts CPanel:
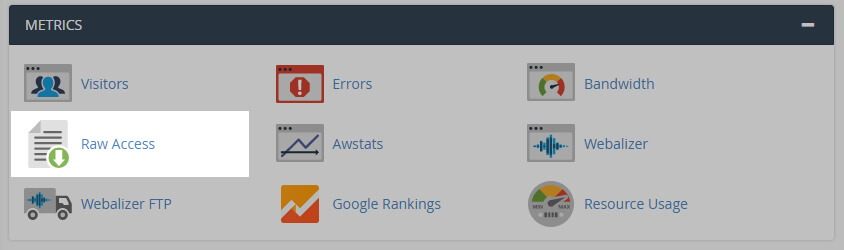
Click on “Raw Access Logs”.
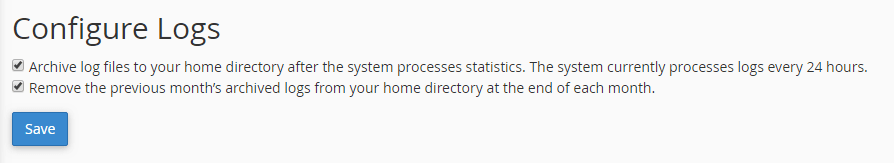
Make sure that your logs are configured by ticking the boxes. Your logs will start to be logged once on the date you configured this.
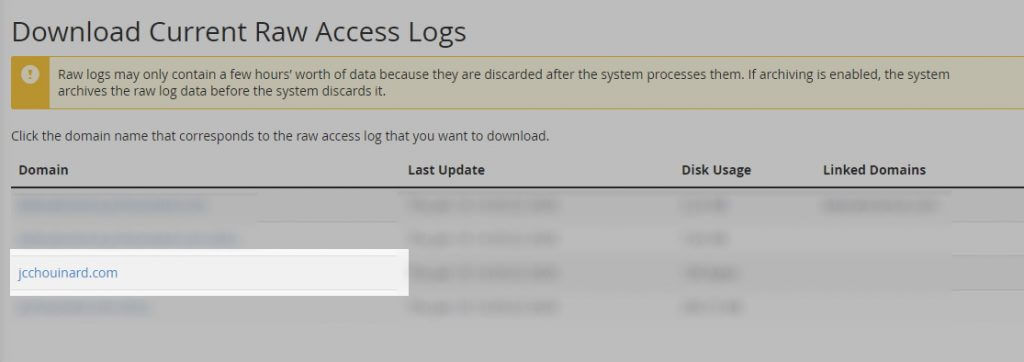
Click on the domain that you want to extract your logs.
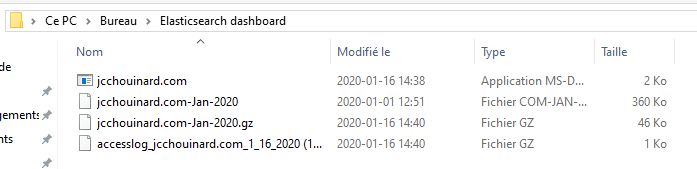
Create a file for your Elasticsearch project and save your logs into it.
Step 2: Download all your ElasticSearch tools
We will download three Elasticsearch Modules: Elasticsearch, Filebeat and Kibana.
- Elasticsearch is the database where your logs will be stored;
- Filebeat is the log analyser that processes your log before sending them to Elasticsearch;
- Kibana is your Dashboard.
Create a new folder
Create a new folder in your work folder to add all the ElasticSearch Modules. Since I will be downloading V.7.3.1, I create a folder for that version.
Makes it easier to manage versions.
Download the ElasticSearch tools
When downloading the Elasticsearch tools, make sure that you always use the same version. The version .7.3.1 is the last stable release, so better use this one instead of the latest.
Save and extract all your downloaded files in your created folder.

Step 3: Install latest version of Java
To run, Elasticsearch needs the latest version of Java.
Download Java and go through the installation process.

Create an environment variable
Once downloaded and installed, you need to set-up an environment variable with your Java JDK.
Search Windows and type “Environment variables”.
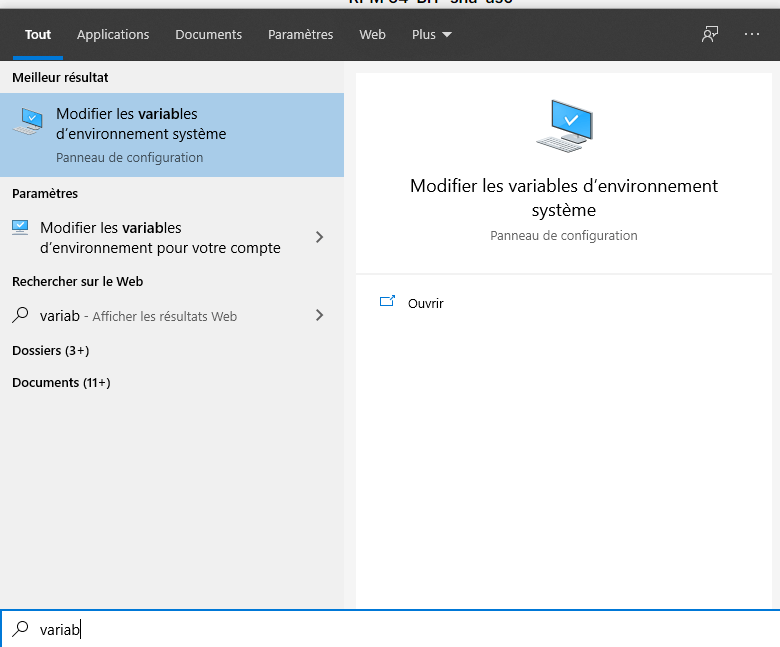
Click on “Environment variables” > “New”.
Give a name and add the path to your downloaded Java JDK.

Step 4: Set-up and run Elasticsearch
Now, we will attempt to “start” Elasticsearch. Here we will need to learn a bit of command-line.
Open Windows PowerShell.

Move to your Elasticsearch “bin” folder
In the command line, you can use the cd command to navigate through your folders to get to the “bin” folder.
The “bin” folder is where your executable file (the software you use) is located.
You can drag and drop your folder after the cd command to add the path where your file is located.

The path that you are looking for is the one ending with \elasticsearch-7.3.1\bin.
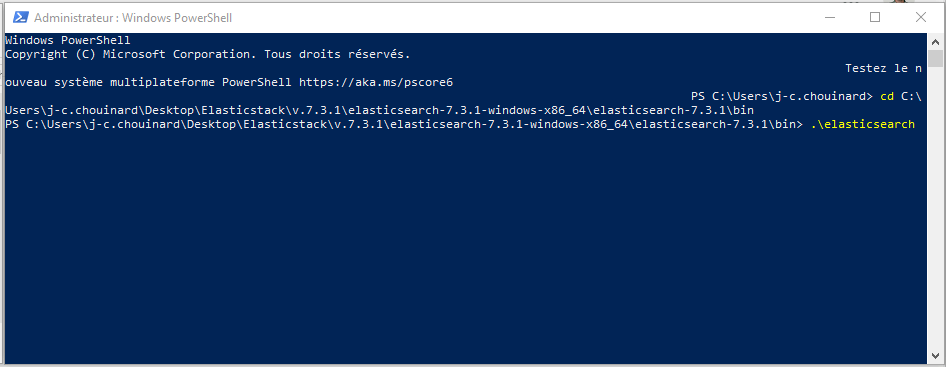
cd
 C:\Users\<YOUR-USERNAME>\<PATH-TO-FILE>\v.7.3.1\elasticsearch-7.3.1-windows-x86_64\elasticsearch-7.3.1\bin
Press Enter.
Execute your Elasticsearch file
Once you are in the folder, you will need to execute the elasticsearch.bat file by using the .\elasticsearch command.
Somewhere in the execution, you’ll see a line that looks like this.

The line with your IP address tells you which IP you are using and the port used to run elasticsearch. In this case it is the 9200.
If you want to find this information or add custom configuration, you can also open the elasticsearch.yml file located in the config folder.
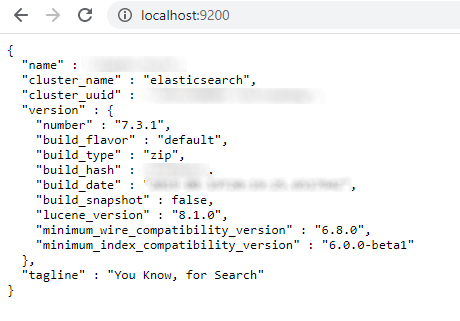
Open your browser to the localhost:port
Open your browser and type “localhost:9200”.
You can see that the ElasticSearch Cluster is running.
Step 5: Set-up and run Kibana
Starting Kibana is similar to starting Elasticsearch.
Open a second PowerShell instance.
(Don’t close the first that is currently running)
Use the cd command to move to the Kibana “bin” path.
cd
 c://kibana-7.3.1-windows-x86_64/bin
Execute the kibana.bat file using the .\kibana command.
.\kibana 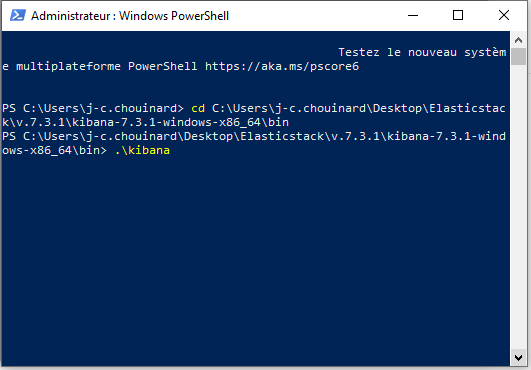
Again, the Shell should tell you in which port Kibana is running.

In your browser, Kibana will be accessible to the localhost port specified.

Step 6: Set-up your own logs
If you have your own logs from step 1, click on “Explore on my own”.
Then, click on “Add log data”.
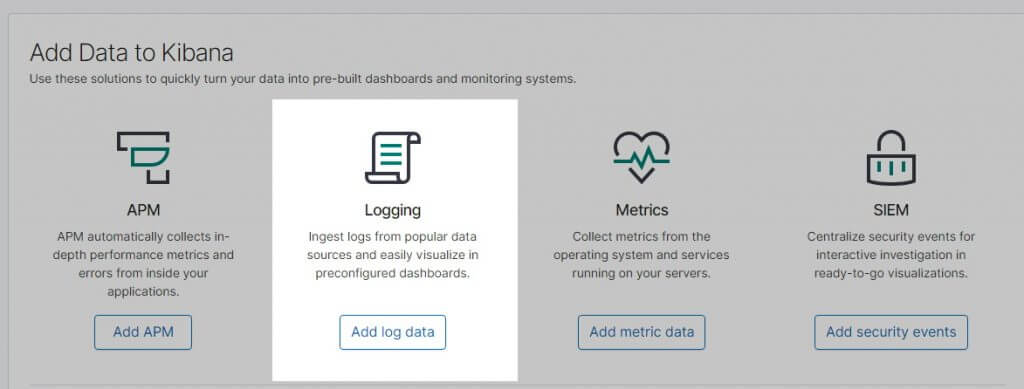
In my case, my server logs are Apache.
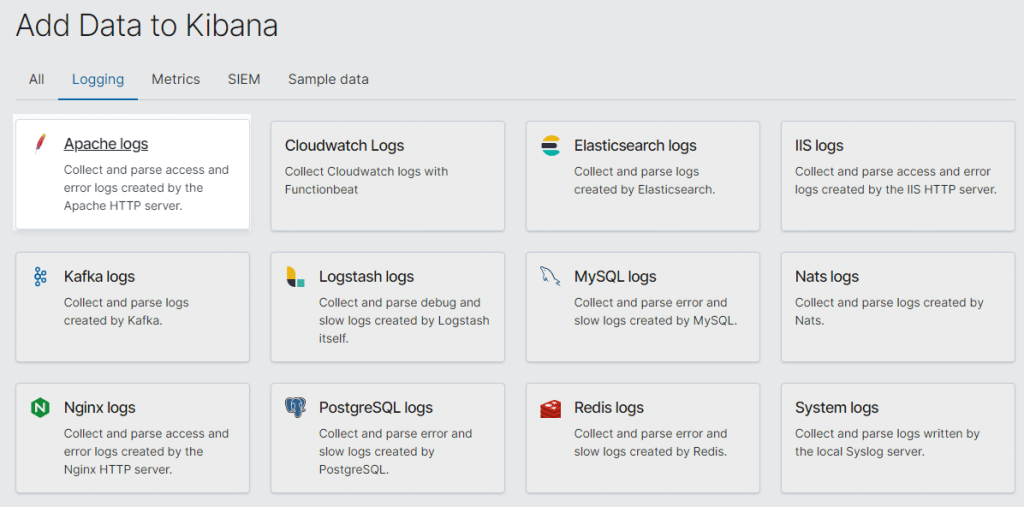
If you don’t know what technology is on your servers, chances are they are using either Apache or Nginx.
Just make a quick search on Google to learn about your host servers’ technology.
Step 7: Set-up Filebeat
The window that opens gives you the instructions to set-up Filebeat.
Filebeat will be needed to interpret your logs before you send them to Elasticsearch.
Follow the instructions on screen to set-up Filebeat.
1. Download and install Filebeat
We have already done this in Step 2.
Just make sure that you install the same version as Elasticsearch and Kibana.
2. Edit the configuration
You can configure Kibana with a password. Since, I am working on my local computer, I don’t bother with this and leave as it is by default.
Follow the instructions to set it up.
3. Enable and configure the apache module
Enabling and configuring the apache module is the most important step.
Run Filebeat
Open a third Powershell instance.
(Don’t close the other two, they need to be up and running)
Go to the installation folder using cd.
cd C:\\filebeat-7.3.1-windows-x86\ Then, run this command to enable apache.
./filebeat modules enable apache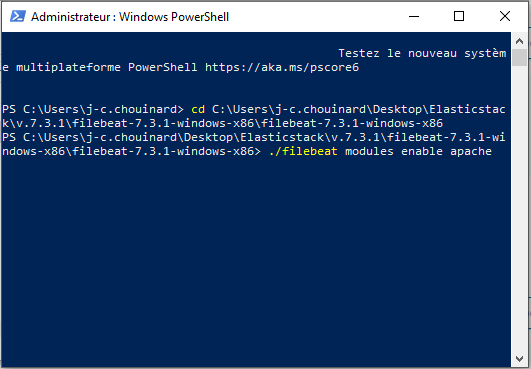
Modify the Apache.yml file
If everything went well, apache.yml in the modules.d folder should now be enabled.
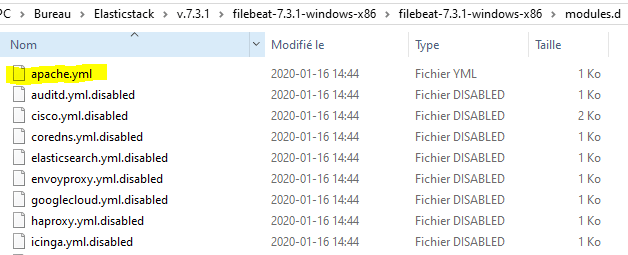
Modify the Apache.yml file to add your log file Path.

4. Start Filebeat
Make sure that Kibana is up and running in your browser.
Then, add this command in your Filebeat PowerShell instance.
./filebeat setup

./filebeat -e
Click on “Check data”.
If everything is right, you should have a Success Message telling you the “Data successfully received from this module”.

If not, Filebeat has a problem with your log file.
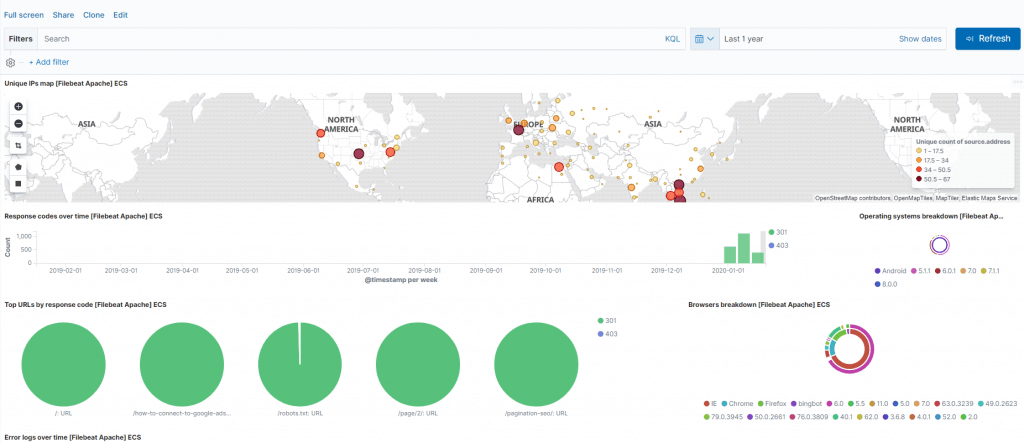
Click on “Apache Logs Dashboard” and you are done.
A brand new free and amazing server logs dashboard!
Opinions expressed in this article are those of the guest author and not necessarily Search Engine Land. Staff authors are listed here.
Related stories
New on Search Engine Land
About the author