How To Estimate The Traffic Opportunity For Multinational Campaigns
Recently, I was asked to run an estimate of traffic opportunity for a multinational sports franchise in which I modeled their current global traffic against brand visibility growth opportunities. However, I also identified that to make the estimate relevant, I needed to quantify the traffic more than they had suggested. So, like all good Web […]
Recently, I was asked to run an estimate of traffic opportunity for a multinational sports franchise in which I modeled their current global traffic against brand visibility growth opportunities. However, I also identified that to make the estimate relevant, I needed to quantify the traffic more than they had suggested.
So, like all good Web marketers do, I got revenue involved in the equation. Want to know how to understand the revenue opportunity available to your brand globally? Read on…
Calculating The Size Of The Pie
First up: what’s the current global reach of my client?
To understand that, we get involved with the Audience reports in Google Analytics. (If you’re not using GA, you really should. With the advent of multi-touch attribution and custom channel cost centres, there’s no longer any reason not to jump onboard.)
Depending on your multinational architecture (if you’re interested, check out my thoughts on the best multinational structure for SEO), you may need to run against a master ‘Global’ profile, covering all of your existing domain names for a fair comparison of any gaps. See this post on common analytics mistakes made by multinationals for how to set up that tracking structure if you’re not already using it — it’s a lifesaver for this type of work.
Set your time period to be a full year and also run to at least the last three months to ensure you’re looking at up-to-date info. This is important for relevant outcomes and to avoid seasonal trends skewing the graph. Switch into eComms figures, select for 100 results and export as a CSV. Next, we want to segment-out brand traffic.
Segment-Out Brand Traffic
Yep, we don’t want to colour our estimation by incorporating data into our model which represents people to whom we can’t attribute new business driven by online.
Generic search terms represent a demographic which isn’t using search as an extension of their bookmarks to navigate to the client site. We want to see what performance we have which is bringing in: new business, new eyeballs on the website, new future converts to the sporting achievements of our sports franchise client.
From the same filters already used, add a secondary keyword dimension, filter-out all variations of the brand using the advanced filter (including typos, domain terms, ‘Not Provided’ and ‘Not Set,’ etc.). Then, set your results to 500 and export the CSV.
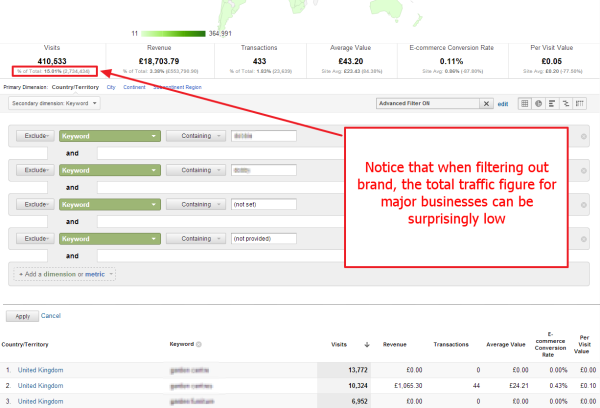
You’ll find that you have a dominant country or two in the top 500; and, to achieve our estimate, we only need to get a rough steer on opportunity. Thus, we will now create a table of the performing domains by duplicating the tab, selecting all and ‘Removing Duplicates’ in Excel.
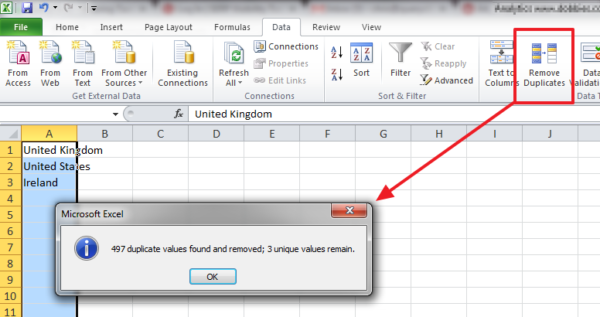
Then, use SUMIF next to each domain to match against the domain name and total up our traffic from each location.

We can then compare total visits from the first spreadsheet to this figure to get a rough ratio for non-brand to brand, which you should now use as a factor against the first CSV report to present a ‘non-brand’ column.
As a note on this process: for very large sites, the limit for our sample set of 500 (GA’s limit) may be too restrictive, in which case, run a separate report in GA in Traffic Sources, filtering by the location flagged in the dedupe stage above, as well as by brand, to get a more accurate non-brand factor. For most sites though, this step is overkill in terms of the final estimate’s value as a guide.
Now, we have a total for the top 100 currently performing countries, and a factor telling us what proportion of that is brand and non-brand.
What’s The Opportunity?
To take revenue, and likelihood to generate revenue, into account, I used three resources:
- Internet World Stats’ compendium of online population figures by region, in which I dug out the detailed stats for each region and compiled it into a master spreadsheet (for example, here’s Europe’s stats).
- Wikipedia’s summary of BEA’s data on per capita disposable income.
- I weighted countries by language. The franchise is obviously based in one country – English language speaking in this case – so it makes sense that as part of a rollout of their international marketing efforts, some weighting for ease of content dissemination is taken into account on the model.
Then, simply drag the data from each of these items into different tabs on your spreadsheet and normalise the country location data (use TRIM and run VLOOKUPS alongside each to mark True/False for it being listed in the other tabs; use a filter and filter the false rows to identify what the mis-match is). Common cleaning up is normalising the likes of ‘The Ivory Coast and Coté D’Ivoir, and so on.
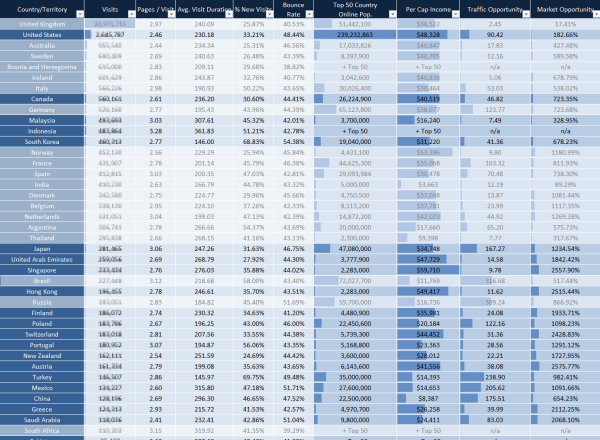
Once that’s done, you can extend the original Google Analytics tab data to include the online stats for the country, and calculate a ration for the ‘Gap’ between current traffic and opportunity. (I calculate this for both Brand and Non Brand to allow for filtering of targets for online marketing targets, and offline brand-raising marketing campaigns.)
Then, do the same opportunity analysis against the per-cap disposable income figure and (the important part!) relate the per-capita gap to the online population gap to give you your final, greatest traffic and revenue opportunity figure.
The language weighting, I applied by using conditional formatting to VLOOKUP against the preferred countries, allowing them to stand out regardless of the filters used to segment the country opportunities in the spreadsheet.
There you are — now, you know your market opportunities in a very broad-brush fashion, and in an easily replicable format for other websites. Obviously, I’d suggest you dig further into the nuances of your client’s market before making final decisions on where budgets should be allocated; but as a starting point, it’s a great way to flag up some under-targeted locations for businesses that truly aspire to be multinational.
Oh, and if you fancy getting a little more involved in this modal, I’ve further refined it to drill into the analytics data on a city-by-city basis to suggest local PPC budget underspends and achieve micro-multinational targeting.
Opinions expressed in this article are those of the guest author and not necessarily Search Engine Land. Staff authors are listed here.
Related stories
About the author