How to use Google’s new price competitiveness report in Merchant Center
See how your product pricing compares to your Google Shopping competitors.
The price competitiveness report began rolling out in Google Merchant Center (GMC) for eligible sellers last week. This new report can show you how your prices compare to other merchants selling and promoting the same products in Google Shopping campaigns.
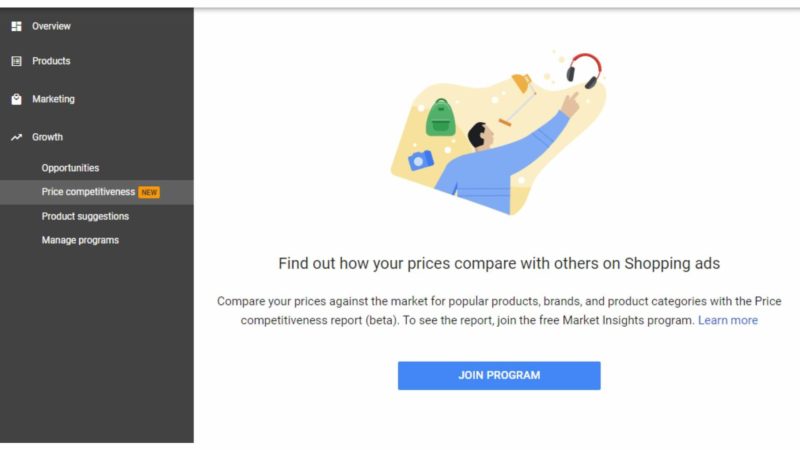
How to get started. The report, in beta, is located under the Growth section in the left-hand menu in GMC. To join, you first have to opt into the Market Insights program. “Additionally, the account using the program must meet certain minimum requirements for participation in Shopping ads or Shopping Actions,” says Google. Per the policy, you are not allowed to repackage, sell or embed this data elsewhere.
What the report shows. You can see the price competitiveness of your products — when the data is available, more on that later — by category, country and brand. From there you can drill down to see individual product benchmarks.
The data goes back to October 14, 2019.
How to use it. One subtlety to note is that the report reflects the percentage of Shopping auctions — rather than the number of product — in which there was or was not a benchmark price.
Depending on how widely the products you sell are searched and promoted by other merchants, you may see a high percentage showing “no benchmark price.” In the example below, 68% of the seller’s Shopping campaign auctions didn’t have enough data to establish benchmarks during the time period. You can click on any of the segments to remove them from the chart below.
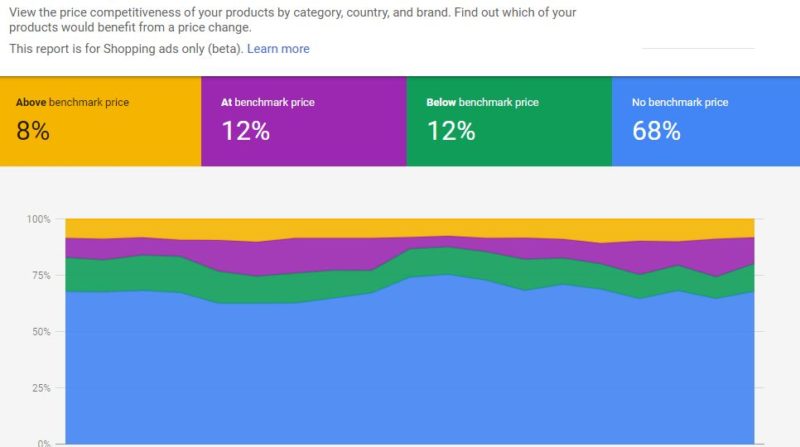
The “above benchmark price” segment indicates the percentage of auctions in which your products were more than 1% higher than the benchmark. “At benchmark price” shows the percentage of auctions in which your products were within 1% +/- of the benchmark price, and “below benchmark price” represents auctions in which your products were at least 1% higher than the benchmark.
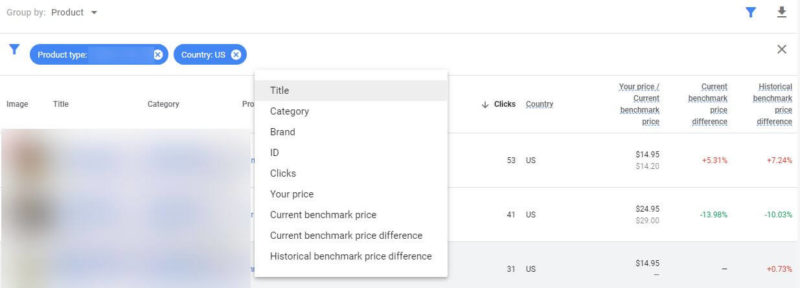
You can then dig into the product-level reporting to see the number of clicks a product has received during the timeframe selected, your price vs. the current benchmark price and both the current and historical differences of your product compared to the benchmark, as shown below. You can filter, sort and download the report as well.
Why we care. Product pricing can play a big role in both product visibility and traffic from your Google Shopping campaigns, as research by Crealytics has shown. And as we reported last April, Google has been saying that price competitiveness and seasonality will “soon” become factors in smart bidding for Shopping campaigns.
You may not have the power to set or change product prices (though you can share this reporting with the teams that do), but this report can help add another dimension to your analysis and tactical decisions for your Shopping campaigns.
Hat tip: Duane Brown.
Opinions expressed in this article are those of the guest author and not necessarily Search Engine Land. Staff authors are listed here.
Related stories
About the author