Merkle: Google paid search spend up 23% in Q2, thanks to non-brand text & shopping ads
Google, Bing Ads and Amazon are all seeing growth in shopping ads.

In the US, Google saw second-quarter search ad spend grow around 20 percent from the same period last year, in keeping with what we’ve observed in previous quarters. Meanwhile, Bing and Yahoo recovered from Q1, and shopping ads on all engines have begun to account for still more click share among retailers. Those are among the findings in Merkle’s Q2 2017 Digital Marketing Report released this week.
Non-brand search driving growth on Google
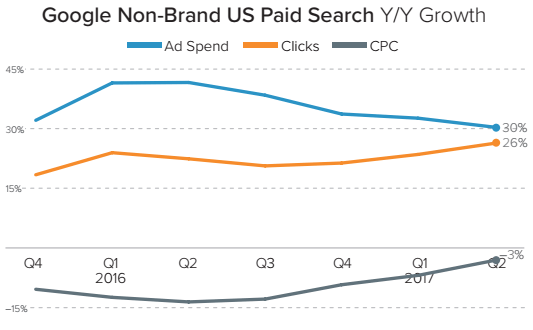
Overall, Google search spend increased 23 percent year over year in Q2 2017, which represents a faster rate of growth than the company saw in Q1, when the year-over-year figure was 21 percent. Clicks were up 18 percent from the same period a year ago, and CPCs were flat.
Non-brand PLAs and non-brand text ads were responsible for driving Google’s growth in Q2. Overall, non-brand ads saw 30 percent growth in ad spend and a 26 percent lift in clicks year over year for the quarter.
The non-brand text ads saw spend rise 21 percent year over year in Q2. For comparison, last year, non-brand text ad spend rose just 8 percent year over year.
Merkle credits the growth in non-brand text ads to several factors: the de-coupling of tablet and desktop bidding, increased ad load — up to four text ads show on mobile, for example — and the fact that advertisers are getting better returns from these ads and reinvesting in the format. (More on PLAs below.)
The changes Google made to Ad Rank minimum thresholds in May to take query intent into consideration may have contributed to a decrease in brand CPCs, says Merkle.
Brand CPCs fell 8 percent year over year for the quarter and 14 percent in June year over year. Overall, Google CPCs rose less 1 percent year over year.
Google buoyed by its mobile edge
Combined, Bing Ads and Yahoo Gemini paid search spend recovered from the 14 percent year-over-year drop seen in Q1, with spend dipping 3 percent year over year in Q2.
However, mobile is a real challenge for both of these platforms. Despite being launched primarily as a mobile ad vehicle, mobile made up just 22 percent of clicks on Yahoo Gemini. Mobile inventory remains a challenge for Bing Ads, with mobile accounting for 12 percent of Bing Ads’ clicks in Q2.
By comparison, phones accounted for 52 percent of Google search ad clicks and 64 percent of spending growth in Q2.
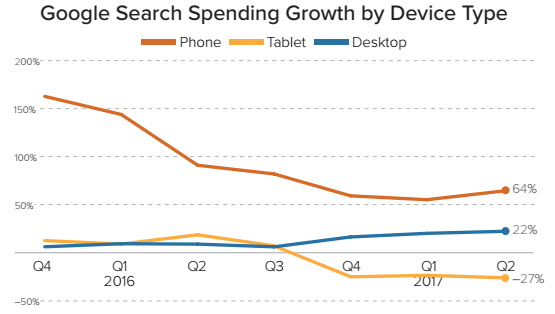
On the Google Display Network, mobile drove 43 percent of spend in Q2, up from just 18 percent a year ago. Desktop’s spend share slipped from 73 percent in Q2 2016 to 45 percent in Q2 2017.
Desktop still lives
It’s not time to count desktop out just yet, however. Google’s move to (re)separate desktop from tablet has led to better performance on desktop, and with that, spending growth. Desktop search ad spend was up 22 percent year over year in Q2.
Expanded text ads accounted for 74 percent of text ad impressions on Google in Q2, up from 72 percent in Q1, and Merkle says it now sees consistently better click-through rates from ETAs than from standard text ads.
Shopping Ads are driving growth for Google, Bing and Amazon
In the US, retailers increased PLA spend 31 percent year over year in Q2, compared to just 16 percent on text ads. PLAs accounted for 75 percent of non-brand Google search ad clicks and 53 percent of Google search ad clicks overall for those retail and consumer goods advertisers. 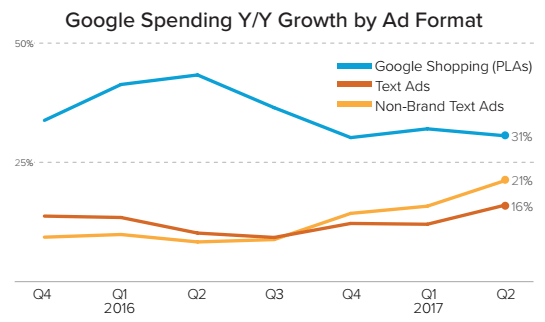
On desktop, PLAs continue to outperform text ads, garnering higher conversion rates and revenue per click, even as average order value continues to be lower for PLAs.
Apparel was the only product category among those that Merkle tracks that saw declining PLA click share growth in Q2; it fell from near 60 percent share in Q1 to 52 percent share in Q2.
Bing Product Ads saw 11 percent spend growth year over year in Q2, up from flat growth in Q1. Overall, Bing Product Ads accounted for 20 percent of retailers’ overall search ad clicks and 34 percent of non-brand ad clicks on the Bing Network.
Amazon is continuing to test the Google PLA waters. An analysis of AdWords Auction Insights data showed Amazon’s impression share within home goods increased about 15 percentage points between the end of April and mid-May.
As for Amazon’s own Sponsored Products ads, which Amazon sellers can use to promote their products on the platform, adoption has been limited compared to Google PLAs so far among Merkle’s retail clients.
Among those running Amazon Sponsored Product ads, however, spending increased by 43 percent between Q1 and Q2 2017.
Opinions expressed in this article are those of the guest author and not necessarily Search Engine Land. Staff authors are listed here.
Related stories
New on Search Engine Land
About the author