Multi-Touch Attribution & Conversion: Does It Matter?
When it comes to multi-touch attribution, I recently realized that most advertisers have pretty much the same questions: How does one know whether it is worth digging into the conversion funnel? What are common patterns from a multi-touch standpoint? How can one actually leverage the conversion funnel? Based on my conversations, here are some answers […]
When it comes to multi-touch attribution, I recently realized that most advertisers have pretty much the same questions:
- How does one know whether it is worth digging into the conversion funnel?
- What are common patterns from a multi-touch standpoint?
- How can one actually leverage the conversion funnel?
Based on my conversations, here are some answers and insights.
Average Time Lag & Path Length From Impression/Click To Conversion
Before digging into cross-channel conversion funnels (or even campaign to campaign traffic) we need to know how many clicks on average are associated to a conversion as well the average amount of time from first click to conversion.
These two metrics are essential in evaluating what is the average buying cycle duration and how many impressions/clicks it takes for Web users to convert.
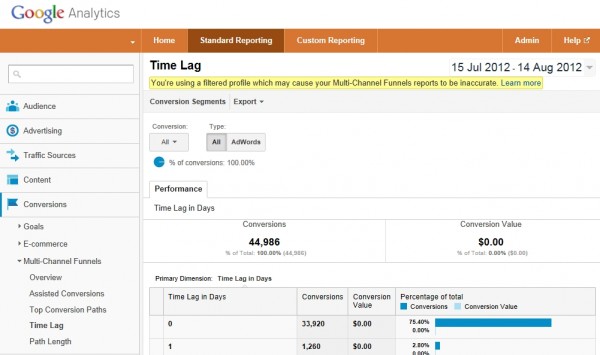
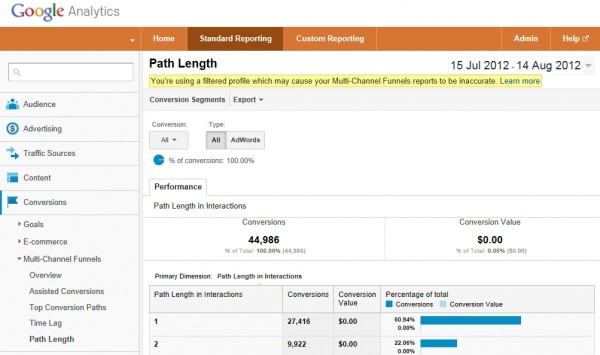
In Google Analytics, you can check out those two metrics in ‘Standard Reporting>Conversions> Multi-Channel Funnels’:
In Google AdWords, the time lag and path length can be found in ‘Tools & Analysis>Conversions>Search Funnels’:
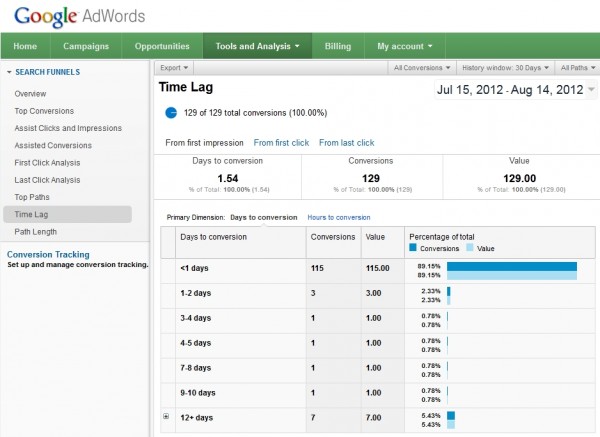
What one should really care about is the percentage of conversions not occurring the same day as the impression or click. More specifically, the average time lag from impression/click to conversion can help marketers define was a relevant cookie window should be to optimize the entire buying cycle.
In the above example, 89% of all conversion occur within the same day of the first impression and roughly 94% of all conversions occur within the same week. A 7-day cookie window would cover 94% of all conversions and would seem adequate here.
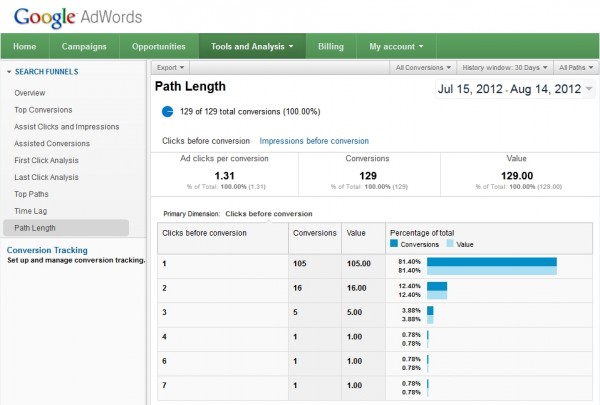
As for the average path length, one should care about those conversions which do not occur after just one impression or click. This indicates whether it is worth spending more time and effort moving away from a traditional last-touch approach.
In the above example, the average path length is 1.31 clicks and – more specifically – 18.6% of all conversions occur after more than just one click. In other terms, you are not optimizing those 18.6% of conversions the right way if you only are looking at the last touch point.
Generally speaking, one should definitely look into what happened prior to the last touch point if the percentage of conversions occurring after more than one impression or click is greater than roughly 10%.
Now you should have a better idea of the average conversion cycle duration, as well as the percentage of conversions occurring after more than one impression/click. At this point, you should be able to tell whether or not digging into the conversion funnel is worth it.
Look Into The Top Conversion Paths
The next step is to understand what those touch points are, and what a common conversion path is.
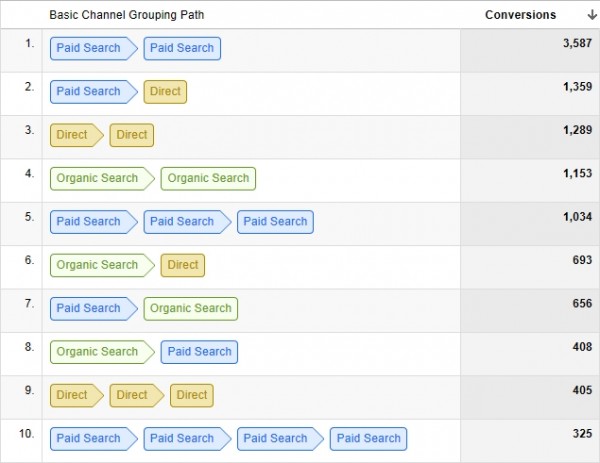
In Google Analytics, you can click to ‘Standard Reporting>Conversions> Multi-Channel Funnels>Top Conversion Paths’, then you can pick a primary dimension such as ‘Basic Channel Grouping’:
In AdWords, those top transition paths show in ‘Tools & Analysis>Conversions>Search Funnels>Top Paths’, then you can select a primary dimension such as ‘Campaign Path’, Ad Group Path’, ‘Keyword Path’, or ‘Query Path’.
In both GA and AdWords, the bottom line is that you can now tell exactly what a typical transition path is from a channel to another or from a paid search keyword to another.
In the above example, the most common path is first ‘Paid Search’ click followed by a second and final ‘Paid Search’ click. This information emphasizes the need to investigate how different campaigns, ad groups and keywords are actually assisting others.
The second most common path here is a first ‘Paid Search’ click, then a final ‘Direct’ click; this means you might not be currently be allocating those 1,359 conversions back your paid search program, though that is where they originated from.
At that point, you should be able to tell what top transition paths are, and from a broad perspective what aspects of your marketing efforts should get more credit as well as those which should get less credit.
Attribute Conversions Back To All Touch Points
The next and final step is to effectively allocate conversions back to all touch points in order to determine the true CPA/ROAS by channel and/or by paid search campaign, ad group, or keyword.
This is definitely the tricky part mostly because neither AdWords nor Google Analytics provide that functionality (yet). So for the time being there is no automated way to do this – you’ll have to manually calculate the numbers. Based off the above example and assuming there are only 5 transition paths, you could run the numbers in Excel and apply custom percentages (by channel in this case).
In the example below, I’m applying three different models: last click attribution, even distribution, and 60% on the first click then even distribution on all other clicks. There are many different models out there but from my experience these three are widely used.
Then, you just need to reconcile these conversion numbers with the ad spend and you should be able to measure your true CPA/ROAS by channel.

A more sophisticated way to go about this is to leverage third-party tracking platforms which support multi-touchpoint attribution. There are a couple of them out there; however, I obviously am most familiar with my company’s solution. In this system, you can easily toggle between different revenue attribution models, and you can also build custom bidding strategies that take into account up to 5 touch points over the past couple of days, weeks, or even months. This type of technology has become essential when driving conversions through multiple online touch points.
Opinions expressed in this article are those of the guest author and not necessarily Search Engine Land. Staff authors are listed here.
Related stories
New on Search Engine Land
About the author