SMX replay: Create dashboards that inform and persuade
Sam Marsden of DeepCrawl explains how to use data visualization to get faster buy-in from management and stakeholders.
Data insights are only as effective as your ability to communicate them in a way that results in buy-in from colleagues, management and clients. That’s why Sam Marsden, SEO and content manager at DeepCrawl, has turned to data visualization using Google’s Data Studio to help stakeholders make more informed decisions.
During Marsden’s Insights session at SMX Advanced, he explained that creating impactful dashboards can revolutionize your reporting and provided some examples of how it has helped his team reduce friction, strategize and save time.
You can listen to his full session above, then continue reading for his tips on getting the most out of your dashboards. The full transcript is also available below.
When building out your dashboards, Marsden recommends that you:
- List the areas where you waste time on reporting, whether it’s report creation, insight extraction or sharing your findings.
- Research and build automated dashboarding solutions that get you to the data you need to see as quickly as possible.
- Repurpose your dashboards to fit the needs of different stakeholders by creating different views for each of them (e.g., one dashboard might have separate pages for senior management and SEO practitioners).
- Use visualizations to tell compelling data narratives and make business cases. Live demos can work really well, just make sure your dashboard is fast enough to cope and that it functions as you expect it to beforehand.
- Invest in skills and tools that will help you build more effective dashboards, like data visualization theory, regex, and BigQuery.
- Get involved with the Data Studio community by sharing dashboard templates, guides
and experiences. There is so much to learn from smart folks from different corners of the marketing spectrum.
For more from SMX Advanced, listen to Patrick Stox’s Insights session on SEO that Google tries to fix for you, Amanda Milligan’s guide on using data storytelling to earn top-tier media coverage or Ashley Mo’s tips on improving your YouTube ad performance.
What did he say? Here’s the full transcript
Introduction by George Nguyen:
Just what good are your brilliant audits and analysis if you can’t communicate the insights in a way that persuades clients, management and stakeholders?
Welcome to the Search Engine Land podcast, I’m your host George Nguyen
and the question that I just asked comes from Sam Marsden, an SEO and content manager at DeepCrawl.
Breaking down silos is a common struggle for brands and agencies. To help resolve the issue, Sam visualized his data using Google’s Data Studio. The benefits for him — and hopefully for you, as well — included streamlined workflows with colleagues and clients, better organization,
fewer unnecessary conversations and disruptions as well as more interest from management.
You’re about to hear Sam’s Insights session from SMX Advanced, in which he explains how to create dashboards that inform and persuade. After you’re done listening, I encourage you to check out Patrick Stox’s session on SEO that Google tries to fix for you — that’s another great time saver — or one of our other SMX replays. Links to those can be found in the article accompanying this podcast. For now, here’s Sam…
Sam Marsden:
Good afternoon everyone. My name is Sam. I work as an SEO and content manager at a web-crawling platform called DeepCrawl. If you can’t tell by my accent, I’ve come all the way all over from London. And yeah, I’m really excited to be here in Seattle at such a great conference and speaking about automating reporting and dashboards.
So, I pitched this talk, it was probably a couple of months ago now and I had these lofty ambitions of revolutionizing your reporting, sharing some impactful dashboards and hopefully making you more efficient in your job. So, Chris from SMX got back to me and said, “That sounds like a great idea. We’ve got a slot available for you.” And, my initial reaction was like, “Oh my God, this is amazing. I’m speaking at SMX.” I then went on to read that there was an eight to twelve minutes slot available and that sent me into a mild panic because I’m not great at being concise. I’d been writing a lot about Data Studio over the past, kind of 12, 18 months. So, I’ve got a lot to share on the topic. However, I’m also really obsessed with efficiency and also productivity. So, this is like a really good challenge to fit this into a 10-minute talk.
So, Data Studio is really fueling my addiction
So, these sessions are all about, kind of key insights and one key takeaway. So, I’m going to give you mine straight up: You need to embrace the power of timesaving automated reports. Not only for yourself, but you need to become a dashboarding evangelist within your company. And I’m going to be sharing a few different ways that I’ve been going about that within DeepCrawl. And, hopefully it’ll give you some inspiration for how you can do this with your colleagues, clients, etc.
So, Data Studio has been helping me work with management. It wasn’t too long ago that I was getting frequent requests for site traffic data from my marketing director, Jen, who’s here. It involved a lot of last-minute screenshots for management meetings. It was quite disruptive, repetitive and an inefficient way of working. Yeah, so, sorry Jen, but it was like, it was quite annoying.
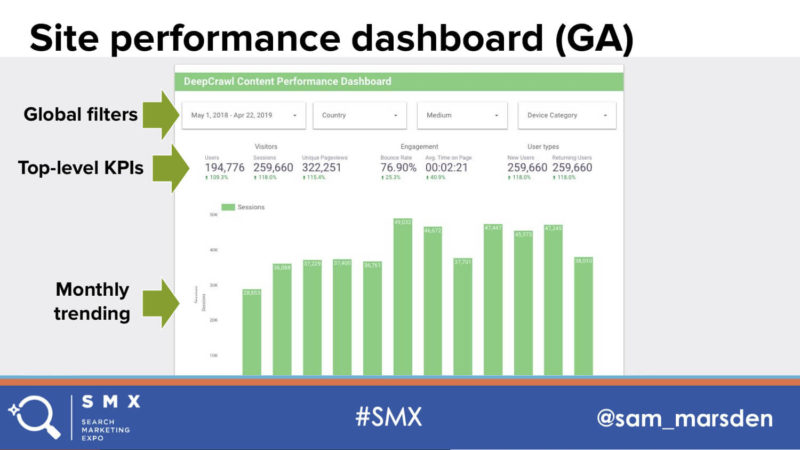
So, what I went to create is a site performance dashboard within Google Analytics, or in Data Studio using Google Analytics. So, I had a lot of top level KPIs in there running across the top as you can see here. And that gave Jen all of the information that she needed, along with some monthly trending below that. And, so instead of having to come to me, Jen could go straight to the dashboard.
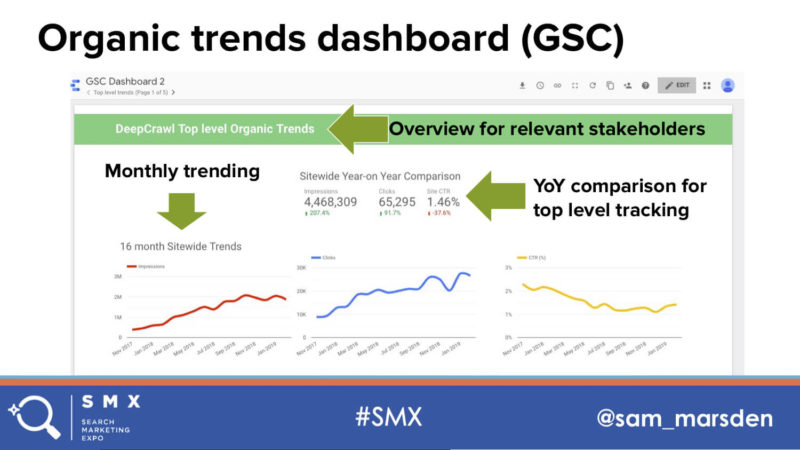
I then went on to create some top level organic trends in this dashboard, which uses Search Console data. Again, we’ve got these top-level metrics across at the top, showing performance status, so you’ve got impressions, clicks and click-through rate. And, then we’ve also got monthly trending below that in a really clear, easy-to-understand graph so that you can come straight in and see the story of the data.
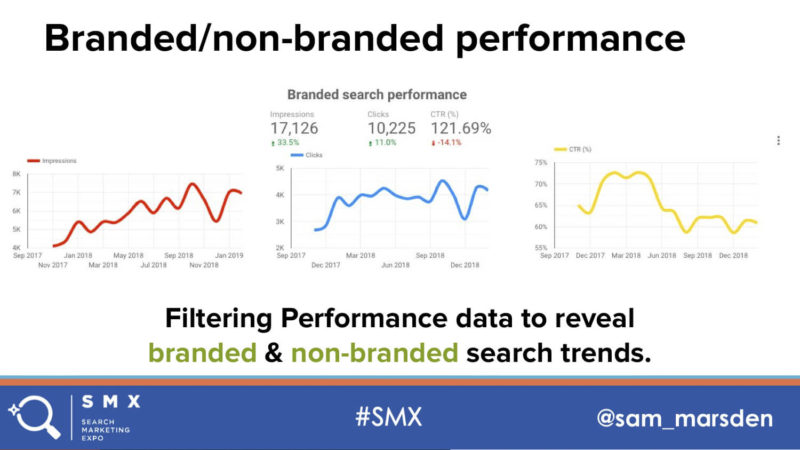
I then went on within the same dashboards to break out a performance for branded and non-branded queries, which might tell you a different story compared to everything rolled up together. I’ve also broken down performance by directory and looking at different areas of the site as well as the breakdown of the distribution by countries and device trends as well, which is something that management might want to see. So, this dashboard is kind of aimed at communicating the top-level insights. It’s not necessarily for SEOs who are in the weeds of that, but with optimization. But yeah, people who have an interest in organic insights.
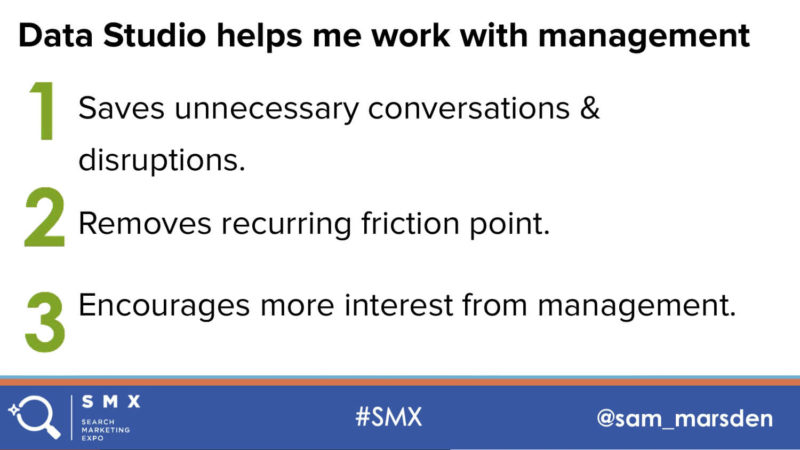
So, Data Studio helps me work with management by saving these unnecessary conversations. It removes this recurring friction point. And now, Jen is a much bigger advocate of the value that I provide to the company. Traffic is communicated within our company updates now. So, yeah, it’s been really positive to see.
Data Studio also helps me work with our content team at DeepCrawl. So I sit within this content team within our marketing team and each month we have a content review meeting. There used to be a lot of manual preparation for this but I decided to build a dashboard using analytics again.
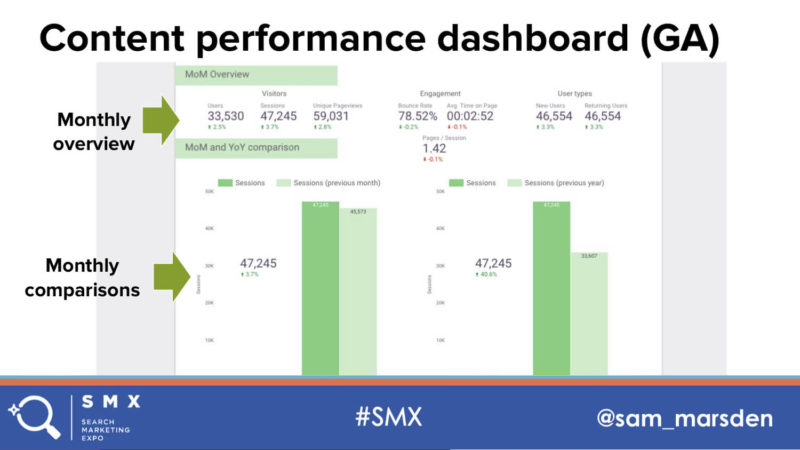
And, so we’ve got monthly overviews looking at the visitor’s engagement, a different user types and then visualization of the monthly comparisons below that. And, interestingly below that, we’ve got a different content types as well. So, at DeepCrawl we regularly put out a different content types like event recaps, webinar recaps, webmaster hangout notes. So what I’ve done is broken down each of those sections to see the overall performance, how that’s tracking from month to month and then some page level stats underneath that to see what’s contributing.
So, this has really helped. It’s saved a bunch of manual prep work, actually guides our content review meetings now, rather than us going round in circles. It keeps them structured and focused and informing our content strategy going forward.
A third way that Data Studio has helped me is with and the onboarding of a new SEO exec. So, we had an SEO exec join us, recently and I wanted to show her how we were using Search Console data. And, I realized that I was accessing Search Console in a really kind of manual way, going into the native user interface and configuring various different reports and it was all quite fiddly and quite time consuming.

So, what I decided to do was build a monthly comparison dashboard. Now, this uses Search Console data; it varies from the other Search Console dashboard because it’s not showing the top-level trends. It’s much more focused on kind of monthly — looking at things on a monthly basis and even a daily basis as well. So, we’ve got the month on month, the month on year comparisons at the top, and then we’ve got these daily trends below that showing impressions, clicks and click-through rate. So, this is really ideal for kind of daily and weekly check-ins.
And then below that, we’ve got a series of graphs looking at, so from left to right we’ve got clicks, impressions and click-through rate, but then we’ve broken down, devices, geographic and search type trends as well. So, these look like quite busy graphs, but the point is that we can detect fluctuations very quickly and use that as a starting point for further investigation. Then I’ve put in some tables as well because sometimes this is just a more efficient way of displaying the data to show you top performing pages, top performing queries.
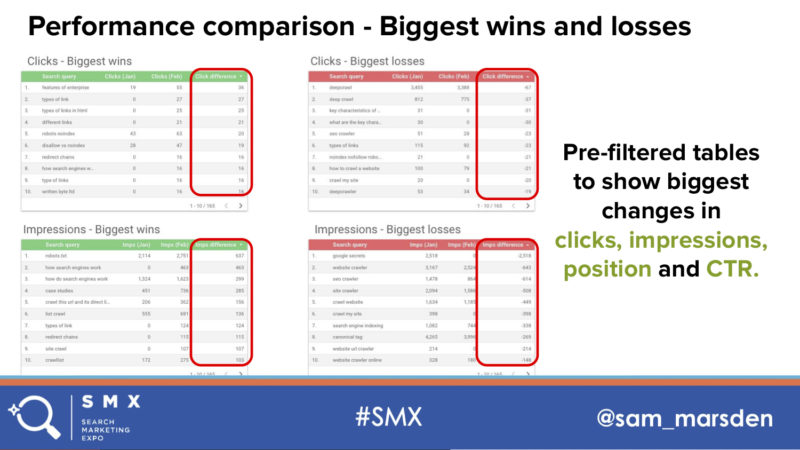
And then we’ve got the biggest wins and losses. So, this is a simple filter that you can set up within Data Studio and it’s showing us where the biggest changes over the last month compared to the previous month in terms of clicks and impressions.
So, the benefits of this are that we get clear monthly comparisons. I don’t need to go through search console and configure this all manually. We can detect fluctuations quickly. It provides an ideal entry point for junior members of staff who are just kind of getting into SEO. And, it also provides this starting point for further investigation.
A few things that I’m working on in the next few months: So, I’m focusing on how we can inform development teams. So, I’m going to look at how we can use crawl insights. We can bring those in through DeepCrawl through our Data Studio connector and look at things like whether there’s differences between the rendered and non-rendered version of crawls and look at various other technical aspects. I’m also going to be looking at how we can assist with site migrations and various other SEO tasks as well. And also visualizing speed metrics, which is something I’ve been working on recently. I’m using the Chrome User Experience report. If you’re interested in finding out more about that, I had a “Whiteboard Friday” published about a month ago now. It was a real, real honor to be a part of that, so, check that out if you’re interested.
But, the kind of key message here is that Data Studio’s not just helped me, but it’s helped me work in a better way with a different teams within my company. And, I appreciate that there are limitations with things like dates studio, but I think the technology is really there and it’s accessible. So, we’re actually limited by the ideas that we can have. So, coming up with different ways of combining different data sources together, we’re constrained by the time with which we have to implement these ideas and the adoption as well — so, persuading others. And I think the remedy to this is that we need to get better at sharing. There’s a thriving Data Studio community on Twitter, but I think we can do a lot better in terms of sharing different guides, different experiences that we’re having with this and how we can get people to adopt these sorts of initiatives.
So, I think it was Mahatma Gandhi that said, “Be the dashboarding change that you want to see in your business.” Now, that might not be a direct quote, but I actually found that the original quote — it wasn’t actually Gandhi that said that anyway — so I think I can have some artistic license to mess around with that.
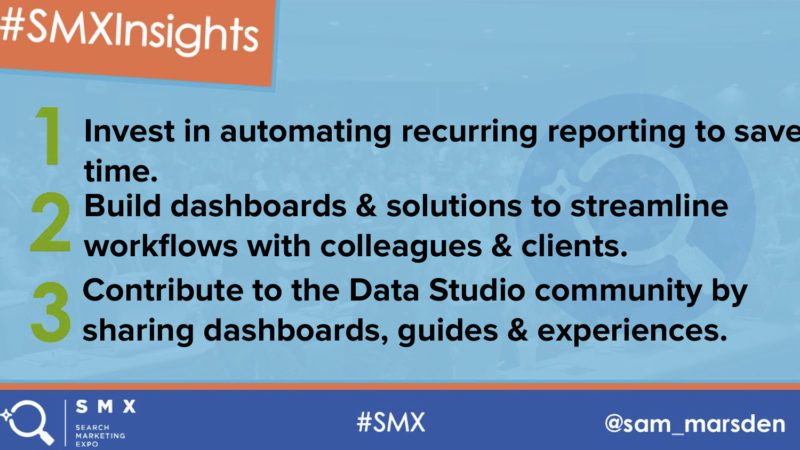
So the key takeaways are: start investing in automating recurring reporting for yourself; build dashboards that help others that you work with, whether that’s colleagues or clients; and also contribute that knowledge to the Data Studio community. And, yeah,
Opinions expressed in this article are those of the guest author and not necessarily Search Engine Land. Staff authors are listed here.
Related stories
About the author