Using Infographics in Social Media to Promote Content and Visualize Data
What are infographics? Infographics, or information graphics, are visual devices that communicate information or data in an easily digestible manner. They have been used for ages by computer scientists, mathematicians, and statisticians to ease the process of communicating conceptual information, support it, strengthen it and present it within a provoking and sensitive context. Since infographics […]
What are infographics?
Infographics, or information graphics, are visual devices that communicate information or data in an easily digestible manner. They have been used for ages by computer scientists, mathematicians, and statisticians to ease the process of communicating conceptual information, support it, strengthen it and present it within a provoking and sensitive context. Since infographics are image-based they usually contain very little text. Images speak a thousand words especially when images are used together to visualize an architecture of information.
Infographics and their influence in Social Media
With so much content being published on the Internet daily, it’s becoming increasingly difficult to be able to check out all the cool things you want to and still have time to get any work done during the day. When it comes to social media users, you tend to have a very short attention span with them to begin with.
If your content isn’t visually appealing and neatly organized, you have a reduced chance of gaining a vote or bookmark from a social media user. Usually social media users will be off to the next piece of content they find interesting if your content doesn’t hook them right away. This is why infographics have played an increasingly important role in social news and bookmarking.
Infographics are very powerful in the regard that they can make dull data or information more interesting with visual appeal. This is important in capturing a user’s immediate attention and directing their eyes through a visual flow of information in a timely fashion.
In my observations, infographics have higher chance of becoming viral and being shared with friends online. It seems the aesthetic appeal and uniqueness of infographics are appreciated by users, and in turn, they reward the content with links, votes, bookmarks, and sharing.
Examples of good infographics
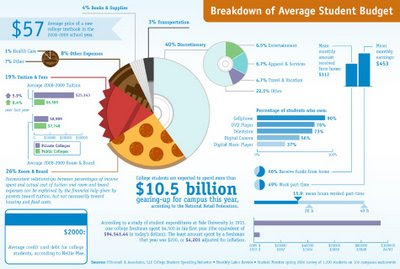
Mint.com’s blog does an excellent job in visualizing financial data. Their latest infographic, China vs United States: A Visual Comparison, received almost 3,000 Diggs and huge penetration in StumbleUpon. Had this been a textual article, it’s safe to say that it wouldn’t have had near the penetration. For Mint.com, infographics have been the key to success for massive amounts of traffic and links.
Another recent hit by Westwood College:
And some more examples of good infographics
Infovideos?
Alternatively, you can even take infographics a step further and animate them into a video format. This allows you to have further penetration on social video sharing Websites as well. The downside is it takes longer to portray all the information you want to share to users so you may have a higher bounce rate. See an example below:
[vimeo]https://vimeo.com/3261363[/vimeo]
Where to begin?
When you’re writing your next article or piece of content that you feel may be somewhat dry or could be visualized easier then it might be a good idea to go ahead and give infographics a shot. Illustration skills are required but being a master of illustration is not important. The best route to go would be to research your data and document it, wireframe a layout of information and form, and hand it off to a designer to visualize it. Work hand-in-hand with them to make sure the element of communication the data is properly being implemented.
Opinions expressed in this article are those of the guest author and not necessarily Search Engine Land. Staff authors are listed here.
Related stories
