Revealing average screen time statistics
In today’s digital world, screen time is an essential part of our daily routine.
From checking emails in the morning on a smartphone to watching videos and doing some focused work on the desktop, screens seem to dominate our attention.
In this post, we’ll explore the latest screen time insights and how they vary depending on the age group and country.
Screen time statistics (Top picks)
- Worldwide, people spend an average of 33 hours and 13 minutes per week on screens.
- In the US, average screen time per week is 43 hours and 55 minutes.
- Filipinos spend 55 hours and 24 minutes on their screens each week
- In Japan, people spend 15 hours and 9 minutes per week consuming online media
Average screen time worldwide
As of Q4 2025, internet users aged 16+ spent 33 hours and 13 minutes per week consuming online media. That equates to 4 hours and 45 minutes per day.
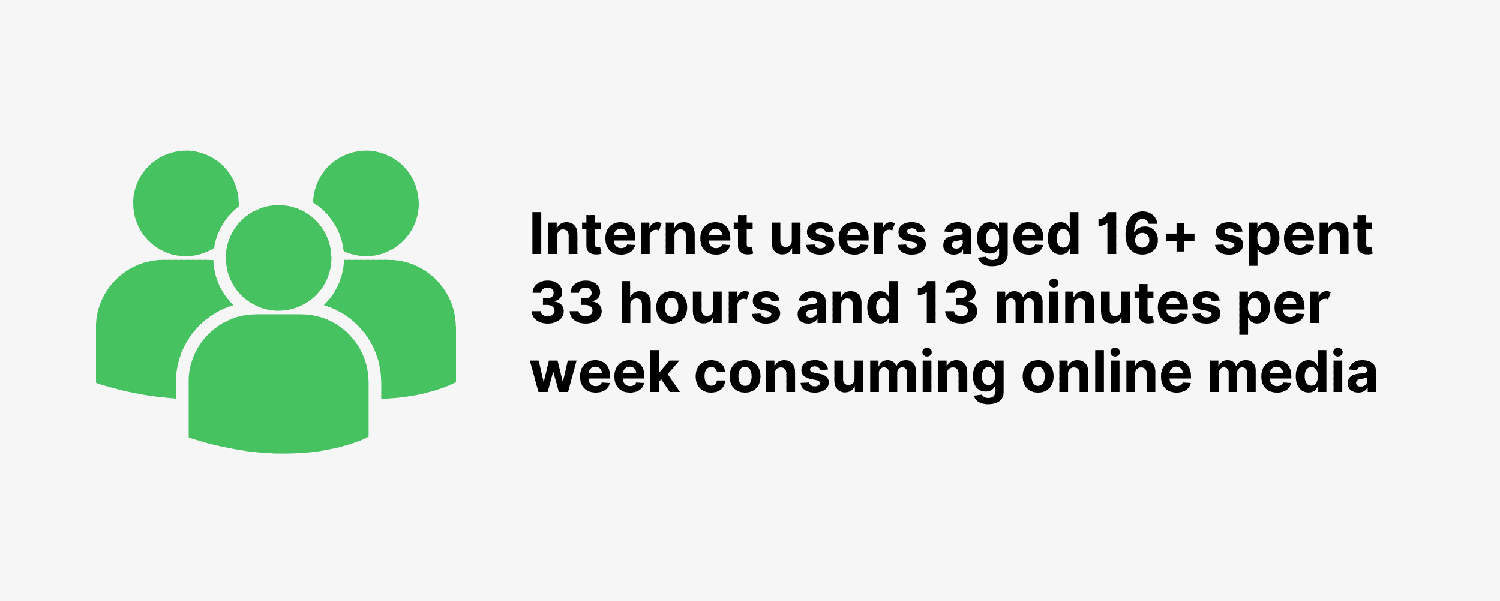
These figures come from GWI, which made significant changes to its approach to surveying time spent with media. As such, it is not comparable to historical data.
Here’s a table with average screen time among worldwide internet users since Q3 2013:
| Date | Average Screen Time | Annual Change |
|---|---|---|
| Q3 2013 | 6 hours 9 minutes | N/A |
| Q3 2014 | 6 hours 23 minutes | +3.7% |
| Q3 2015 | 6 hours 20 minutes | -0.8% |
| Q3 2016 | 6 hours 29 minutes | +2.6% |
| Q3 2017 | 6 hours 46 minutes | +4.3% |
| Q3 2018 | 6 hours 48 minutes | +0.4% |
| Q3 2019 | 6 hours 38 minutes | -2.4% |
| Q3 2020 | 6 hours 54 minutes | +4.2% |
| Q3 2021 | 6 hours 58 minutes | +0.8% |
| Q3 2022 | 6 hours 36 minutes | -5.1% |
| Q3 2023 | 6 hours 40 minutes | N/A |
Source: DataReportal
Average screen time in the US
In the US, people spend 43 hours and 55 minutes per week consuming online media, according to data from Q4 2025.
The most recent figure for average screen time on internet-connected devices among users in the US is 6 hours and 40 minutes (versus the global average of 6 hours and 38 minutes).
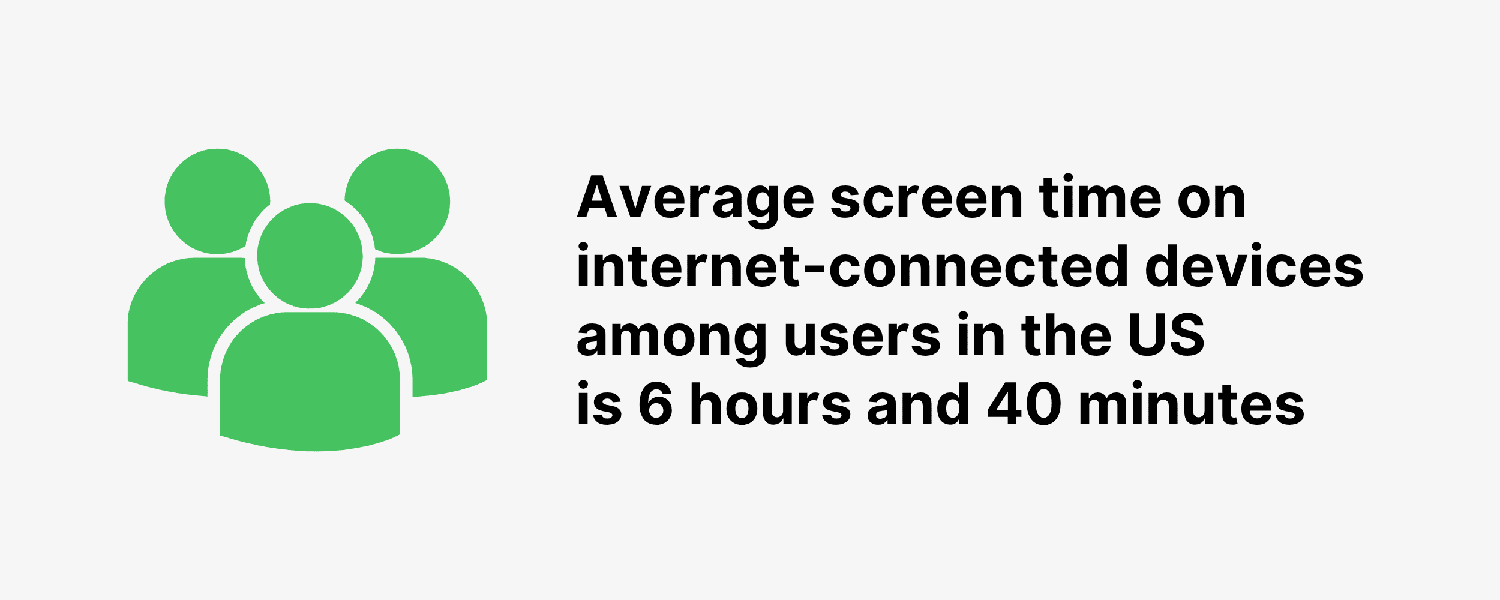
On average, screen time in the US has slightly decreased since 2021 (from 7 hours 4 minutes in 2021 to 6 hours 40 minutes in 2024).
Here’s a table with a breakdown of the US average screen time since 2017:
| Date | US Average Screen Time |
|---|---|
| Q2-Q3 2017 | 6 hours 30 minutes |
| Q2-Q3 2018 | 6 hours 31 minutes |
| Q3 2019 | 6 hours 42 minutes |
| Q3 2020 | 7 hours 11 minutes |
| Q3 2021 | 7 hours 4 minutes |
| Q3 2022 | 6 hours 59 minutes |
| Q3 2023 | 7 hours 3 minutes |
| Q3 2024 | 6 hours 40 minutes |
According to Nielsen data (as of Q2 2023), Americans over 18 years old spend an average of 59 hours and 56 minutes with media per week (which amounts to 8 hours 34 minutes per day).

Media consumption includes the use of TV, the internet/video on a computer, apps/web on a smartphone/tablet.
Here’s a detailed breakdown of screen time with media among Americans 18+ grouped by specific media type:
| Media | Weekly screen time | Daily screen time |
|---|---|---|
| Total use of TV | 32 hours 18 minutes | 4 hours 37 minutes |
| Internet on a computer | 4 hours 56 minutes | 42 minutes |
| Video on a computer | 1 hour 59 minutes | 17 minutes |
| App/web on a smartphone | 16 hours 24 minutes | 2 hours 21 minutes |
| App/web on a tablet | 4 hours 19 minutes | 37 minutes |
| Total | 59 hours 56 minutes | 8 hours 34 minutes |
Sources: DataReportal, Nielsen
Screen time by age
According to recent data, younger users tend to have more hours of screen time per week compared to older age groups.
In particular, people aged 16-24 spend 42 hours and 53 minutes on internet-connected devices (among female users) and 39 hours and 15 minutes (among male users) vs. 19 hours and 30 minutes, 18 hours and 54 minutes (female; male) among users aged 65 and over.
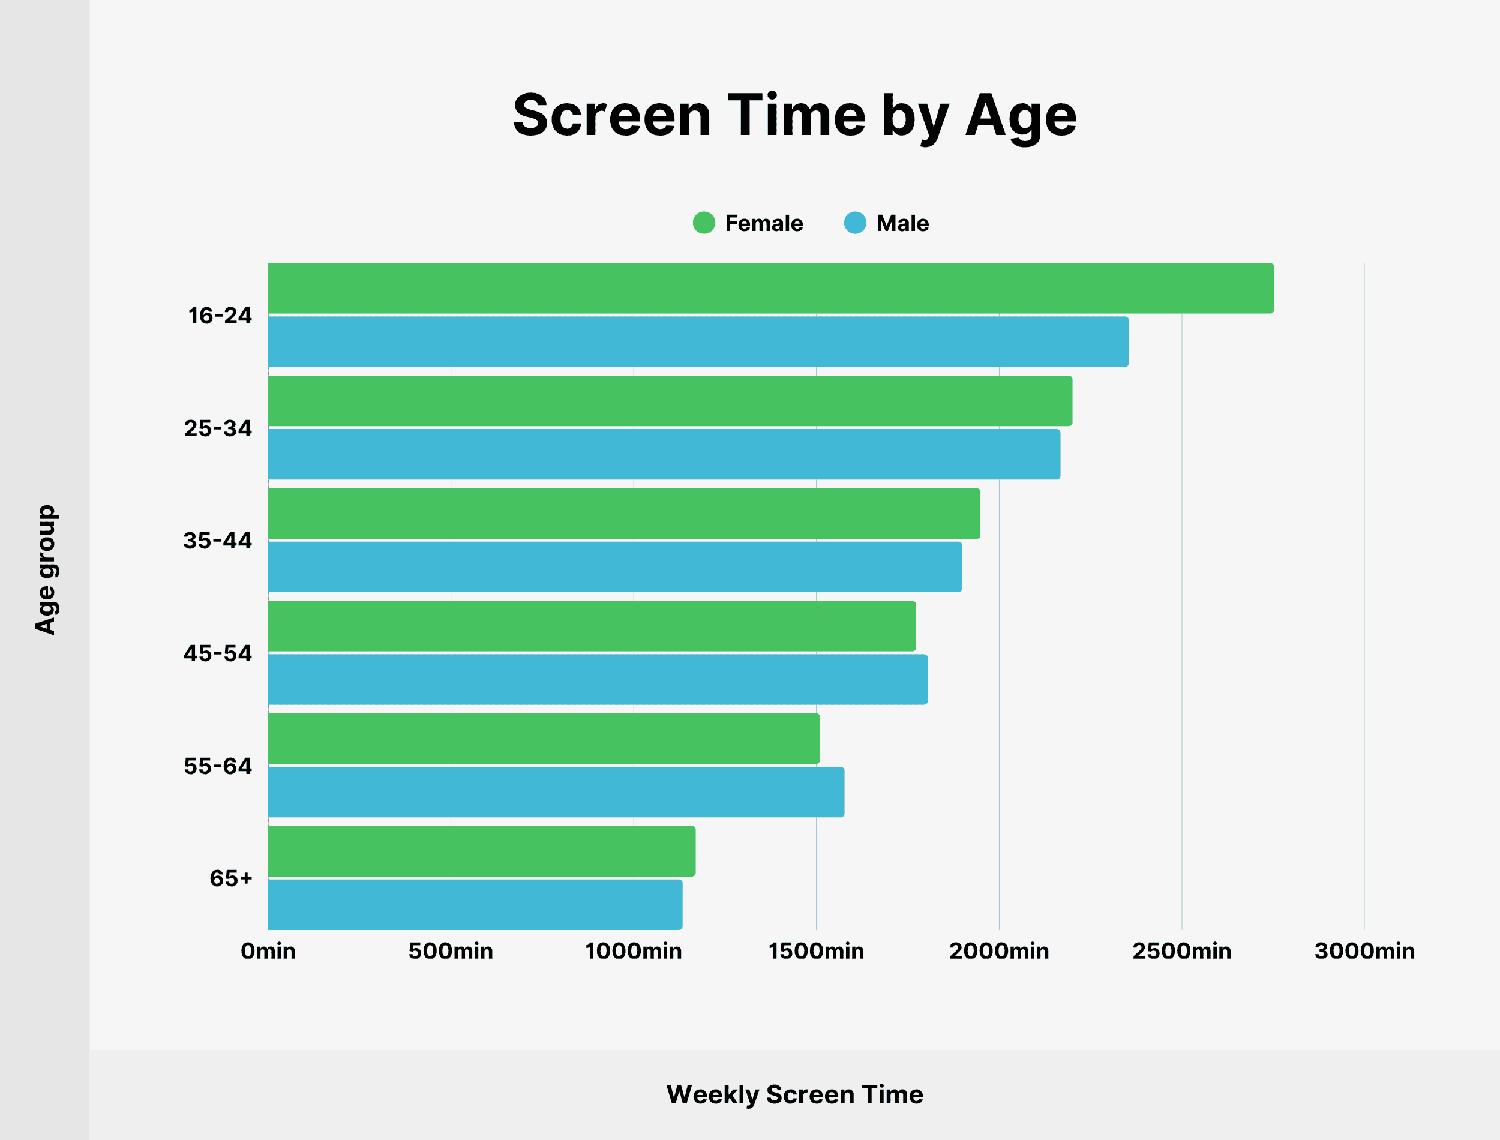
Here’s a detailed breakdown of weekly screen time by age group (data as of Q4 2025):
| Age group | Female Screen Time | Male Screen Time |
|---|---|---|
| 16-24 | 45 hours 52 minutes | 39 hours 15 minutes |
| 25-34 | 36 hours 41 minutes | 36 hours 8 minutes |
| 35-44 | 32 hours 29 minutes | 31 hours 39 minutes |
| 45-54 | 29 hours 33 minutes | 30 hours 5 minutes |
| 55-64 | 25 hours 10 minutes | 26 hours 17 minutes |
| 65+ | 19 hours 30 minutes | 18 hours 54 minutes |
Source: DataReportal
Screen time among children and teens
As of 2026, as many as 98% of two-year-olds watch screens daily.
Data from 2024 shows that children aged 5-8 spend 3 hours 28 minutes on screens. These figures reduce with age, as 2 to 4-year-olds spend an average of 2 hours 8 minutes on screens, while infants aged 0-2 average 1 hour 3 minutes.
Entertainment screen use includes time spent on watching TV, online videos, social media, browsing websites, reading e-books, and creating content.
There has been a reported increase in screen time among tweens (8-12 years old), from 4 hours 36 minutes in 2015 to 5 hours 33 minutes in 2021.
| Year | Entertainment screen time among users 8-12 years old |
|---|---|
| 2015 | 4 hours 36 minutes |
| 2019 | 4 hours 44 minutes |
| 2021 | 5 hours 33 minutes |
The same survey found that among teens (13 to 18 years old) in the US, average entertainment screen time reached 8 hours 39 minutes in 2021. That’s up from 7 hours 22 minutes pre-pandemic in 2019.
Here’s a table with entertainment screen time among teens since 2015:
| Year | Entertainment screen time among users 13-18 years old |
|---|---|
| 2015 | 6 hours 40 minutes |
| 2019 | 7 hours 22 minutes |
| 2021 | 8 hours 39 minutes |
Sources: GOV.UK, Common Sense Media (1), Common Sense Media (2)
Screen time by country
When it comes to internet-connected screen time, the Philippines leads the ranking with 55 hours 24 minutes of average screen time per week (that’s 22 hours 11 minutes more than the global average – 33 hours and 13 minutes).
Out of 55 countries included in the analysis, users in 6 countries spend over 50 hours on screens.
Here’s a complete list of 10 countries with the most screen time (among users 16+):
| Country | Average Weekly Screen Time | Difference with Global Average |
|---|---|---|
| Philippines | 55 hours 24 minutes | +22 hours 11 minutes |
| Kenya | 54 hours 34 minutes | +21 hours 23 minutes |
| Brazil | 52 hours 21 minutes | +19 hours 8 minutes |
| Mexico | 51 hours 47 minutes | +18 hours 34 minutes |
| South Africa | 51 hours 25 minutes | +18 hours 12 minutes |
| Chile | 50 hours 12 minutes | +16 hours 59 minutes |
| Nigeria | 49 hours 30 minutes | +16 hours 17 minutes |
| Colombia | 48 hours 21 minutes | +15 hours 8 minutes |
| Argentina | 48 hours 20 minutes | +15 hours 7 minutes |
| Ireland | 44 hours 9 minutes | +10 hours 56 minutes |
When it comes to the opposite of the ranking, the Japanese have the least screen time – 15 hours and 9 minutes, on average. In fact, it’s just one of two countries included in the survey with less than 20 hours of screen time.

Here’s a detailed list of 10 countries with the least screen time (among users 16+):
| Country | Average Weekly Screen Time | Difference to Global Average |
|---|---|---|
| Japan | 15 hours 9 minutes | -18 hours 4 minutes |
| Hong Kong | 19 hours 43 minutes | -13 hours 30 minutes |
| China | 21 hours 4 minutes | -12 hour 9 minutes |
| Czechia | 22 hours 36 minutes | -10 hour 37 minutes |
| South Korea | 24 hours 3 minutes | -9 hours 10 minutes |
| Taiwan | 25 hours 25 minutes | -7 hours 48 minutes |
| Poland | 25 hours 26 minutes | -7 hours 45 minutes |
| Belgium | 25 hours 57 minutes | -7 hours 16 minutes |
| Switzerland | 26 hours 31 minutes | -6 hours 42 minutes |
| Austria | 26 hours 40 minutes | -6 hours 31 minutes |
Source: DataReportal
Conclusion
That’s it for our collection of screen time statistics.
Incredibly, we spend nearly half of our waking hours glued to screens, whether on a smartphone, desktop, tablet, or TV. And as you can see, our relationship with media consumption continues to change.
Explore more on
Add Search Engine Land as a preferred source on GoogleEditorial disclosure
Search Engine Land is owned by Semrush. We remain committed to providing high-quality coverage of marketing topics. Unless otherwise noted, this page’s content was written by either an employee or a paid contractor of Semrush Inc.
About the author
