Keeping an eye (or three) on your AdWords competitors
Columnist Daniel Gilbert of Brainlabs unleashes another AdWords script -- this time helping you keep track of what your competitors are up to.

We all love to know what our competitors are up to. We shouldn’t care that much — we should probably just get on with being the best. But we just can’t help ourselves.
The best (and only empirical) source of competitor data is the AdWords Auctions Insights report. The only problem with this report is that it’s not easy to see changes over time, you can’t do any filtering, and you can’t add in any of your own performance data to see how competitor changes affected anything. And it can’t be pulled automatically, even after it’s been available for four years.
Anyway, a while back we shared how we visualize the Auctions Insights report at Brainlabs HQ to solve all of these problems. Now we’re back with a souped-up version 2.0 of our script. As well as CPC (cost per click), you can now see how CTR (click-through rate), impressions or searches vary alongside the auction data, and you can pick out which competitors to show. You can also see the same reports for different devices or compare your performance in one stat between devices. This should be handy, now that separate desktop and tablet modifiers are here!
You may be wondering why we’re giving away all this PPC gold. Well, it’s like this:
- I’m a legend.
- This stuff is too good to keep to ourselves.
- It’s cool, but still quite lightweight compared to the Enterprise version in the Brainlabs Tech Stack.
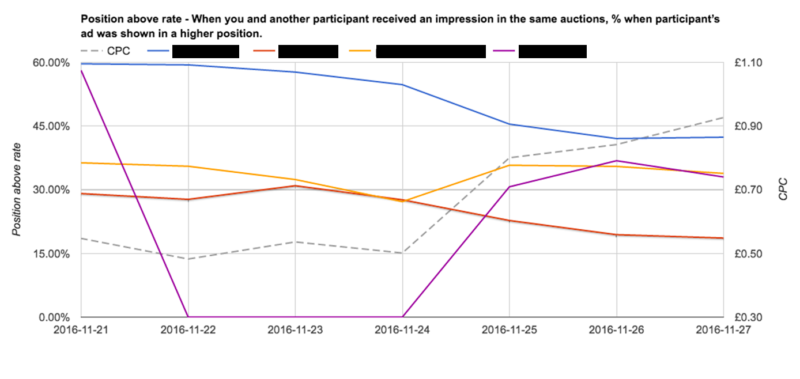
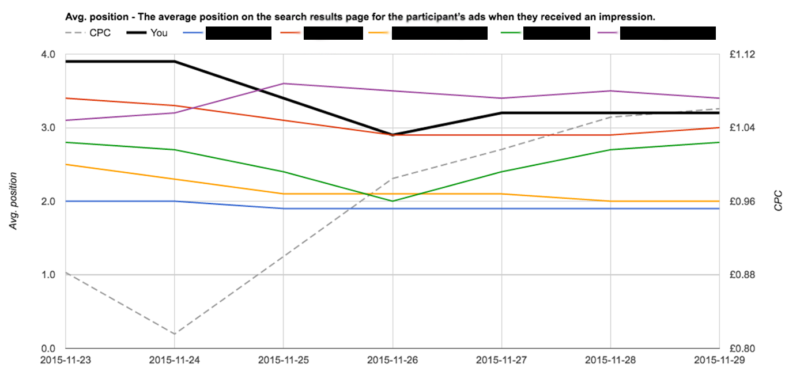
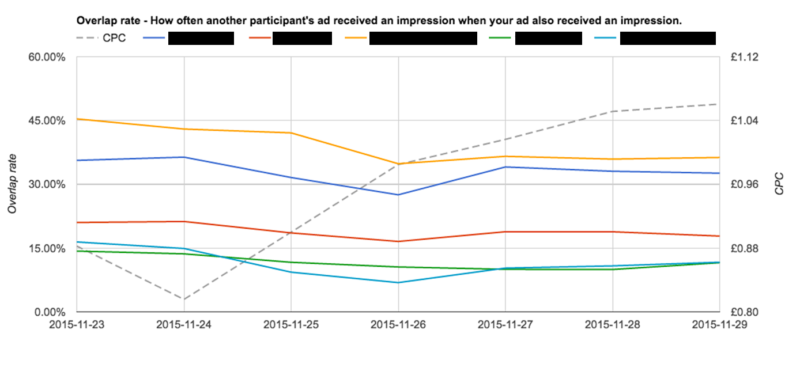
So, here’s what the output will look like. Read on below for a how-to.
To make things easier for you, we have a template spreadsheet with the required sheets and the script already set up. The first step is to open the template, go to the File menu and click “Make a copy…” so you have your own version to fill with your own data.
Then, go to your AdWords account, select the campaigns you want to look at, and download the Auction Insights report, segmented by day, week or month. Copy it to the spreadsheet in the Auction Insights tab. Include the title in the top row — the headers should be on the second row of the spreadsheet.
(If you’re having problems with numbers or dates being wrong — like if Sheets is reading the day as the month, or not recognizing numbers with decimal places — you may need to change the locale of the spreadsheet. To do this, go to File, click “Spreadsheet settings…” and select your country from the Locale drop-down. If you’re using Excel, also make sure the columns are wide enough to show the data when you copy them, otherwise you may find all your dates turned into #####.)
Do the same with the Auction Insights report segmented by the same time period, but also segmented by device. Copy and paste that into the Auction Insights By Device sheet (again, make sure the headers are on the second row).
Lastly, if you want CTR, CPC, impressions or searches, then download a performance report for the same set of campaigns for the same date range, segmented by the same time period and (if you’re looking at device data) by device. You could go to the Dimensions tab and into the Time reports, then download them segmented by device. Or, if you’re only looking at some campaigns, you can go to the campaign view, filter it to only include the campaigns you’re after, and then download it segmented by time period and device. Just make sure there are clicks, impressions and cost columns — CTR, CPC and searches will be calculated from these. Copy this into the Performance Data sheet.
(If there are lots of campaigns, you may hit the limit of the number of cells in a Google Sheet. If that happens, then you can add up all the campaigns’ data for each day and device combination, and copy that into the Sheet — just keep the column headers the same and have them on row 2.)
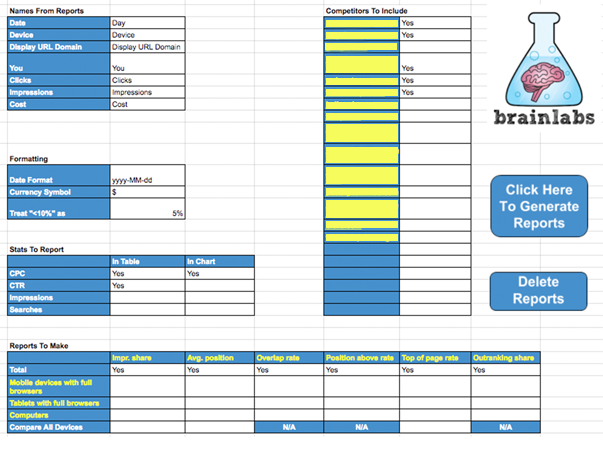
Then, go to the Settings sheet. The cells I’ve highlighted in yellow in the screen shot below are filled in automatically. This includes the competitor names (listed in order of highest impression share), the device names and the column headings (both in the Reports to Make table).
In the Names From Reports section at the top, make sure that Date matches the name of the date column in your reports (which should be “Day,” “Week” or “Month” if the report is in English). Display URL Domain is the name of the column containing competitor names: “Display URL Domain” for Search campaigns or “Shop Display Name” for Shopping campaigns.
You shouldn’t need to change anything else if your reports are in English, but if you’re using a different language, you’ll need to update them: most are column names, and “You” is what the Auction Insights report shows as the domain/display name when it gives your performance.
Formatting is used to format the data. Feel free to replace the date format (e.g., with dd-MM-yyyy or MM/dd/yyyy) and the currency symbol (note the script won’t do any currency conversion for you!).
The Stats To Report section lets you pick which extra columns go in the data tables and which go into charts. Put “Yes” in the relevant cell to include a stat. Some things to note:
- You can only add, at most, two stats to the chart. If you select more, then only the first two are included.
- Note that if you want something in the chart, it has to be in the table (because that’s where the chart gets its data from).
- If you haven’t copied anything into the Performance Data sheet, you can just leave all of these blank.
- “Searches” is (approximately) the total number of available impressions. It is calculated as impressions divided by impression share; as the impression share is rounded, it is not a precise figure, especially if your impression share is low.
The Competitors To Include section should have a list of competitor display domains, drawn from the Auction Insights sheet. Put “Yes” by their names to include them in your reports, or leave the space next to them empty to ignore them.
- All selected competitors will be in the data tables.
- To prevent the charts from being too crowded, only the first six selected competitors are included.
The Reports To Make section lets you pick which reports are generated. The top row is filled out automatically with the column headers from the Auction Insights sheet (because the columns will be different if you’re looking at Shopping rather than Search campaigns, or if your report is in another language).
- The Total row gives you a report of your and your selected competitors’ performance (alongside your selected stats) for all devices. This uses data from the “Auction Insights” sheet.
- There are then three rows for devices, using the names from the “Auction Insights By Device” sheet. Putting a “Yes” for these rows gives you a report of your and your selected competitors’ performance (alongside your selected stats) for the named device.
- The last row is Compare All Devices, which gives you your total average performance and performance segmented by device. This report does not include competitor data.
- You can’t make a Compare All Devices report for columns like “Position above rate,” as they don’t have any data on your performance.
When you’re all ready, hit the “Click Here To Generate Reports” button! You’ll need to give authorization the first time you do this so the script can run. Your reports should all be generated, one report per sheet. If there are any issues, there should be a message box to say what the problem is.
You can also delete all reports with the “Delete Reports” button. Note that if you’ve run the report before, it will delete and remake any of the reports you’ve selected — so make sure you save the output somewhere!

As always, feel free to send me questions/praise/insults on LinkedIn. Unfortunately, I can’t fix this for you if it’s broken — but I promise it works, and it’s amazing!
Contributing authors are invited to create content for Search Engine Land and are chosen for their expertise and contribution to the search community. Our contributors work under the oversight of the editorial staff and contributions are checked for quality and relevance to our readers. The opinions they express are their own.
Related stories
New on Search Engine Land
About the author