Google Charts “Manual Actions” Against Spam In Search For First Time
How often does Google take “manual action” against websites for spam, where a human being reviews a site and decides it deserves some type of penalty? For the first time, Google’s released a chart showing this, going back nearly 10 years. The chart is part of Google’s new “How Search Works” area, and it stretches […]
How often does Google take “manual action” against websites for spam, where a human being reviews a site and decides it deserves some type of penalty? For the first time, Google’s released a chart showing this, going back nearly 10 years.
The chart is part of Google’s new “How Search Works” area, and it stretches back from August 2004 to today (click to enlarge the chart):
 “Legacy” indicates manual actions that Google took that weren’t classified into a more specific category, Google told me. Until around the end of 2007, most everything was either over “unnatural links” or “legacy” — I.E., “other.”
Pure Spam Big, Unnatural Links, Not So Much
Today, by and large, the biggest category involves “Pure Spam,” something that is deemed to violate Google’s guidelines in some way but not in a specified manner, such as for unnatural links or cloaking, both of which are other categories — and which generate few actions, relatively speaking.
Google provides definitions for all these types of spam in an associated page. Oddly, “pure spam” is listed as also including some spam types that also get itemized. The definition:
Pure Spam: Site appears to use aggressive spam techniques such as automatically generated gibberish, cloaking, scraping content from other websites, and/or repeated or egregious violations of Google’s Webmaster Guidelines
After pure spam, “hacked sites” generate the most manual actions, where Google is penalizing sites that have been hacked and are no longer providing the content they originally gained rankings for.
Unnatural link actions, which gained huge attention last year, are well down on the action list.
Not Shown: Automatic Actions
Of course, part of that is due to the fact that Google also does “automatic actions” against web sites, things like the Panda Update of 2011 to fight “thin content” or the Penguin Update of 2012 to fight unnatural links. In these cases, no notifications are sent out. You’re just automatically penalized.
In that regard, the chart doesn’t fully reflect all the spam actions Google takes. It would be nice to see a future chart with complete numbers like that, but this is a start.
“Peak Spam” & The Spam Timeline
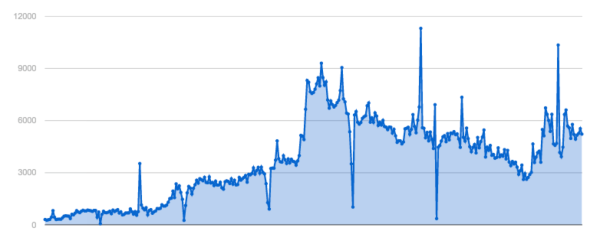
The chart lacks a “total” line, but the “Legacy” and then the “Pure Spam” lines give you a pretty good sense of when manual actions have peaked. “Peak spam” was 553,994 manual actions in one month:

Unfortunately, the date doesn’t show next to the count. Dates are shown for most other points, so I can tell from the points before and after that peak spam — well, the most manual actions over spam — happened in June 2011.
That’s where the associated timeline comes in. Under the chart are key moments in Google’s spam fighting history, such as these:
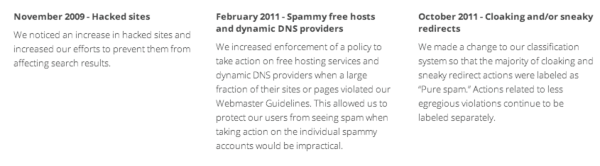
But whatever it was that generated all those actions in June 2011, that didn’t make the timeline. Panda Update 4 (formerly Panda 2.2) happened then, but as that was an automatic (or “algorithmic”) action, it shouldn’t have caused a spike in manual actions.
Reconsideration Requests
Those hit by an automatic actions can only make changes to their web sites and hope that Google will automatically spot these and return them in into good graces. See also these stories for more about that:
For manual actions, people can do what’s called a “reconsideration request.” How often do people do this? Google’s got another chart for that:
Unfortunately, dates aren’t show on this chart, only week numbers. Thanks to a nice week number conversion site, I can see that week 43 in 2010 was the height for reconsideration requests, October 25-31, 2010.
The associated timeline does explain this spike, indicating it was due to an upgrade to Google’s notification system and the start of it sending out more messages about manual actions, resulting in more reconsideration requests.
What percentage of those requests is deemed successful? There’s no chart for that, sadly.
Be sure to read more about Google’s new “How Search Works” area that these charts are from. Our story about that and related features of the area:
- Google Releases Interactive Infographic: “How Search Works”
- Google Charts “Manual Actions” Against Spam In Search For First Time
- WATCH: Google Now Shows Live Examples Of Spam Removed From Its Search Results
Also, at our SMX West search marketing show later this month in San Jose, we have a special session all about search spam, featuring Google’s Matt Cutts and Bing’s Duane Forrester:
The Search Police: Matt & Duane’s Excellent Search Engine Adventure
You name it; Google’s Matt Cutts and Bing’s Duane Forrester have seen it all when it comes to trying to bend, break or shatter search engine rules. In this session, both will share examples of what not to do and why, ranging from accidental mistakes to horrifying spam, as well as general tips directly from the search engines on how to succeed with them.
You won’t want to miss it, and it’s one of over 50 great sessions we have planned. Check out the entire agenda and register!
Contributing authors are invited to create content for Search Engine Land and are chosen for their expertise and contribution to the search community. Our contributors work under the oversight of the editorial staff and contributions are checked for quality and relevance to our readers. The opinions they express are their own.
Related stories
New on Search Engine Land
About the author