What is Google’s Looker Studio and how you can use it
Looker Studio lets you create branded data visualization reports and dashboards. Here's everything you need to know to get started.
Analytics has always been a challenge for marketers.
Data can be confusing, overwhelming and, difficult for the ordinary human to understand and decipher.
In many cases, marketers don’t even report back their clients’ analytics and performance metrics because they’re just not sure where to start — partly because of information overload and difficult-to-understand data.
To make matters worse, for many local SMB clients, showing Google Analytics data – or any metrics data – is about as foreign as seeing an alien spacecraft.
If you’re like most agencies that do provide clients with analytics reports, it typically means laboriously downloading Google Analytics or Search Console data and putting that data into an Excel spreadsheet to create charts and diagrams from there. Or, even more painstaking, copying and pasting information from various sources into a Google or Word doc.
This means having to hobble a pieced-together report that looks anything but professional or easy to understand.
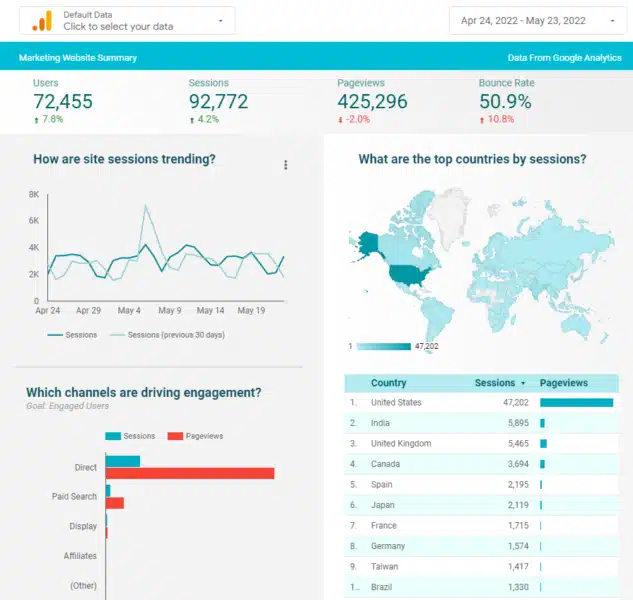
But if you use Google’s Looker Studio, it gives you everything you need to turn your client’s analytics data into informational, easy-to-understand reports through data visualization.
Now you can finally create reports that you and your clients can understand!
What is Looker Studio?
Formerly known as Google Data Studio, Looker Studio is a data visualization platform that makes reports easier to create and understand.
It lets you to bring in sets of data from various places into one location so you can turn that information into an easy-to-understand report.
As a bonus, Looker Studio is free to use.
When you use Looker Studio, you can decide how you tell your “numbers” story to your clients.
You can do all of the following in Looker Studio:
- Use graphics, tables or bar charts.
- Decide what type of numbers and data you want to share.
- Add text to explain data points or what’s displayed in the report.
- Change fonts and colors.
- Brand the report with your client’s logo.
- Add a video to explain something to your client.
The reports are easy to read, easy to share and even customizable to each of your clients.
Another thing that’s cool about Looker Studio is you can pull in more than just Google data – you can import third-party data, like Facebook Ads or Insights, LinkedIn Ads or data from other sources, too.
The reports are also dynamic, so when there’s an update to the original data source, the updated/new information automatically shows up on any reports that reference that source.
Additionally, the reports are shareable, so you can grant people permission to view the reports and/or allow them to make changes – or just view the report.
Looker Studio uses the same functionality as Google Docs and Google Sheets, so all you need to do is press the “Share” button to let your clients or other members of your team view or edit the reports. (For clients, I recommend giving them permission to view only.)
Let’s go over the basics of Looker Studio, the various “pieces” and how they work together.
How to access Looker Studio
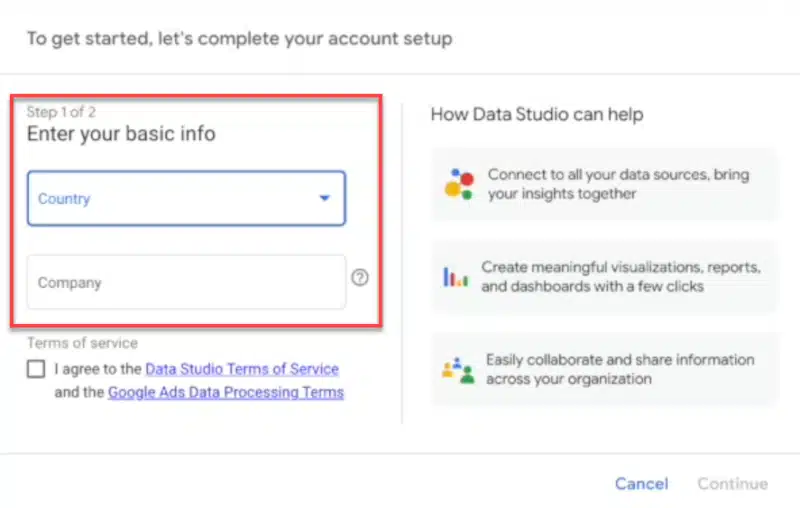
To access Looker Studio, visit https://www.google.com/analytics/data-studio and log in using your Google Analytics login information.
If this is your first time using Looker Studio, you’ll be asked some initial questions, like your country, company name, whether you’d like to receive emails, etc.
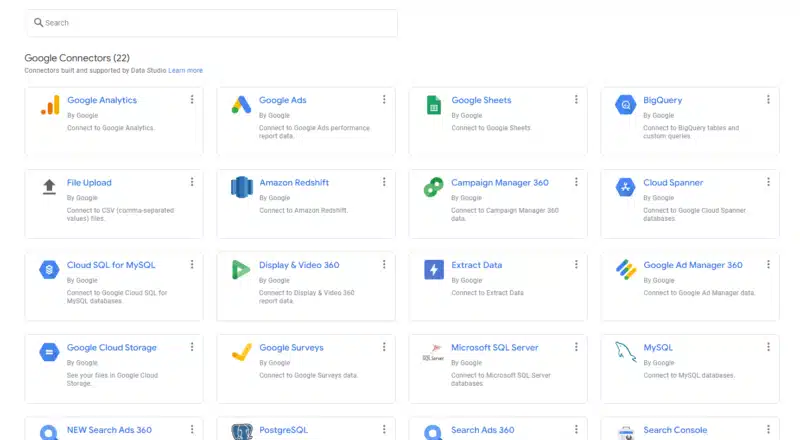
You’ll next be asked to choose a “connector.” For most people, Google Analytics will be one of the metrics you will want to show in your reports.
You’ll then be asked to authorize Google Analytics, or whatever “connector” you are adding. You will simply login, authorize and connect.
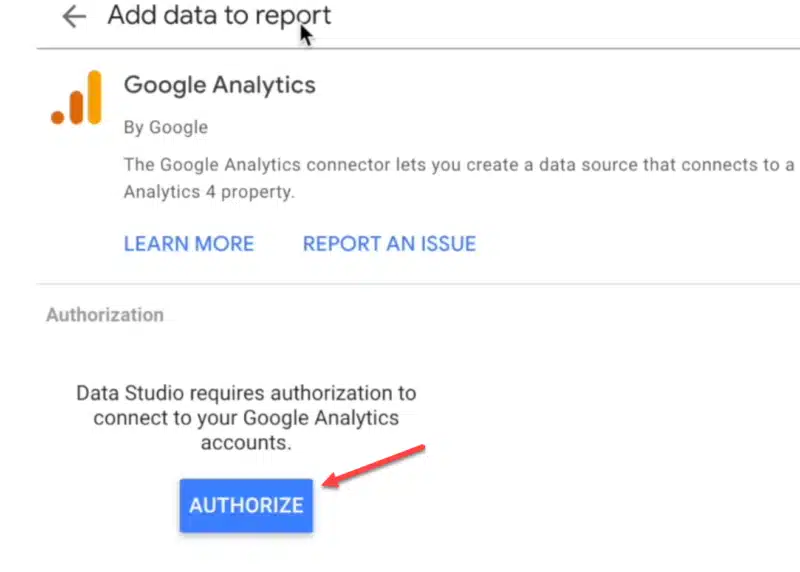
You will then be shown a blank report.
However, you will also see some sample reports/templates that give you an idea of the look and feel of the reports and the types of information you can pull into your custom reports once you get going.
New to Looker Studio?
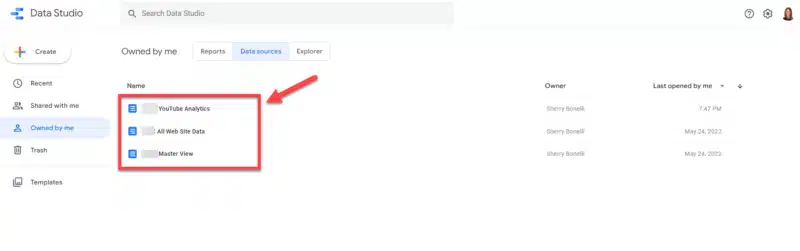
If you’re new to Looker Studio, it’s best to go through the “Welcome to Looker Studio” walkthrough. To get there, click on “Owned By Me” on the left side.
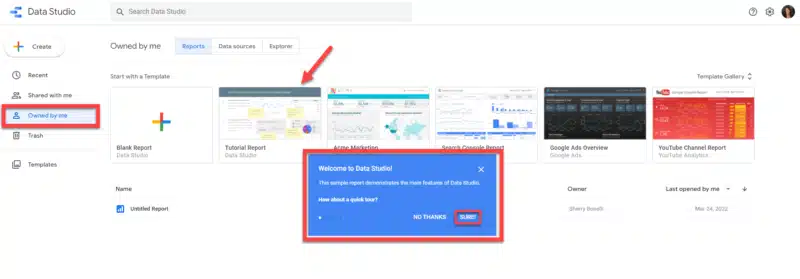
And then choose the Tutorial Report.
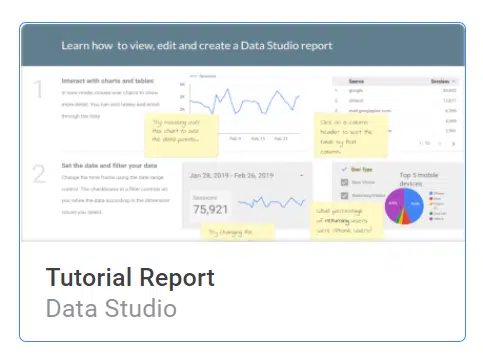
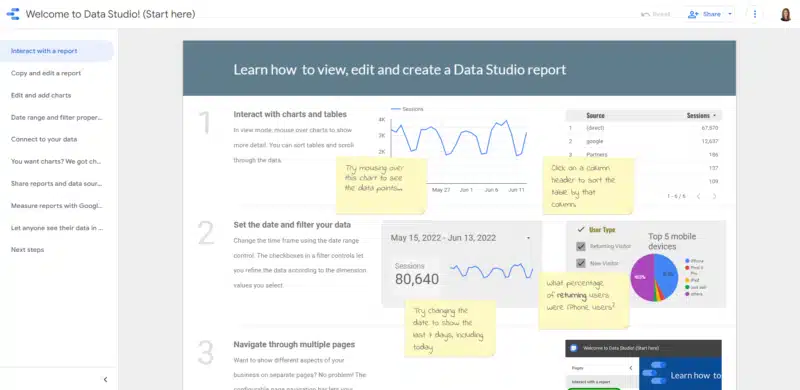
You’re then taken to a visual, interactive tutorial that will walk you step-by-step through what Looker Studio can do and how to get started. Be sure to check this out.
Google also provides you with several Looker Studio videos that you can watch to get overviews of the tool, gives you a walk-through on using the basics, adding data to a report, creating calculated fields and more.
Looker Studio homepage overview
At the top of the homepage, you will see Reports, Data Sources and Explorer. In Reports, you can create reports and data visualizations.
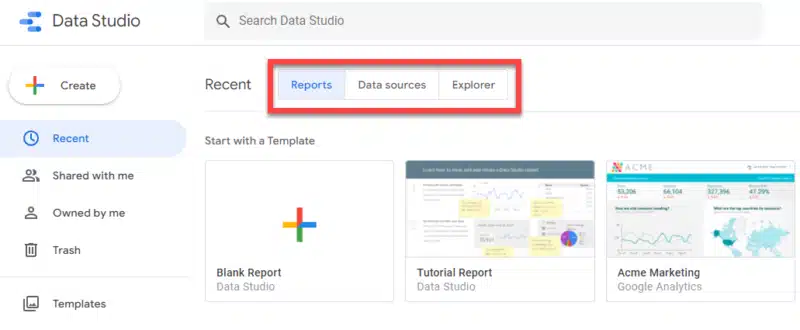
Data Sources are reusable components that connect a report to your data, such as Google Analytics, Google Sheets, Google Ads, YouTube and so forth. Once you’ve connected those sources, they will be displayed here.
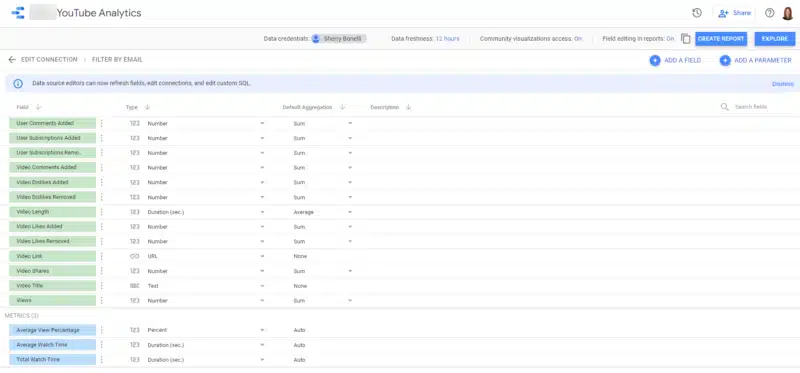
Here’s an example of a connected YouTube account, so you can report on number of video shares, views, average watch time and more.
The Explorer tool is a temporary “scratchpad” where you can edit visualizations and filter data and insights.
This tool helps you find insights quicker because it streamlines the editing and viewing process and applies filters quicker.
Important: These files are temporary unless you save them.
Also, these files are private and cannot be shared directly.
However, if you’d like, you can export these reports to save and share that way.
Looker Studio uses the Google Drive interface, so it’ll be familiar to you if you use any of the various Google products.
If you get lost, all you need to do is click the home button:

Help and user settings
Whenever you’re getting used to using a new tool, it’s always a good idea to know where to go if you need help.
In the upper right corner, you will find the help and settings section.

Here, you can find help documents, new features, video tutorials, report galleries, developer options, account and privacy options and more. And if you click on your smiling face, you can even manage your Google account.
What are your goals for your Looker Studio reports?
Before you set up your first project, you need to decide which campaigns and channels you want to include in the reports you create.
Because Looker Studio is a Google product, its best use is for gathering and reporting Google data, like Google Ads, Search Console, Google Analytics, YouTube, etc. But through the Community Connectors, you can incorporate data from other channels like Facebook ads, LinkedIn ads, Bing and other sources.
Keep in mind, however, that there is typically a fee associated with using connectors that link non-Google-related products. (But if you’re trying to streamline your reporting processes for you or your clients, it can be worth the extra expense.)
Think about your goals. What measurements are important? Is it:
- Click-through rates (CTRs)?
- Page views?
- New visitors?
- Costs?
Planning ahead is important before you start building your reports.
It’s important that you talk with your clients ahead of time to understand their definition of success so you can incorporate the right measurements, stats and data into the reports.
Yes, Looker Studio reports are easy to customize and add to, but wouldn’t it be nice to get it right the first time?
Getting started with Looker Studio reports: Selecting a report template
When you know which channels you want to include in your Looker Studio report, you can get started creating your report.
You can start with a blank report or Looker Studio makes many pre-made report templates available to you. These pre-made templates make it easier for anyone to create a data visualization story that looks professional – and you can still have some fun with creative formatting and customization.
The templates available provide plenty of room to customize data, colors and layout. Whether you’re developing a standard overview for a general audience who want insights into trending topics or are creating a report for a senior-level stakeholder who just wants topline stats, you can create a report that suits every stakeholder’s needs.
The Looker Studio report development process is pretty straightforward. The templates available provide plenty of room to customize your data and layout.
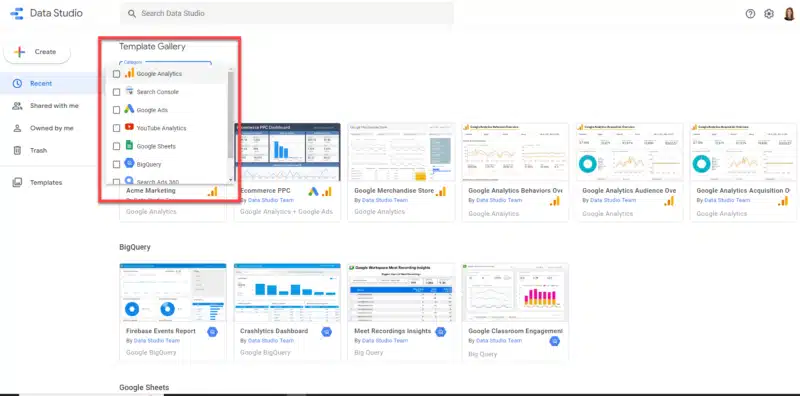
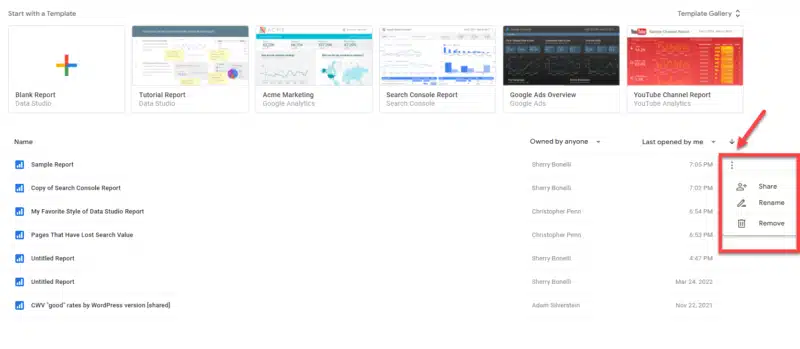
To see the templates, click on the Reports tab and then Template Gallery (on the right side.)

Once you’re in the Template Gallery, you’ll be taken to a slew of templates you can choose from.
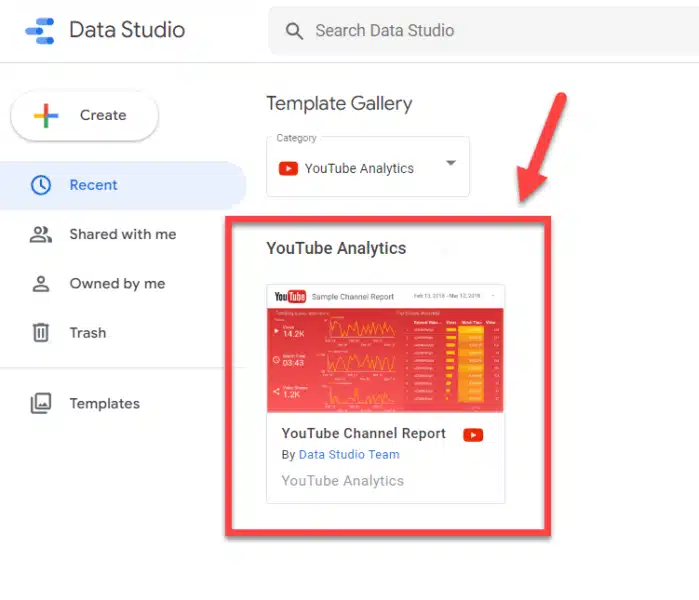
You can use these templates as “starting points” for your reports. You can even choose from the categories drop-down list to help find a particular report template that suits your reporting needs best.
Choose the template that best fits your reporting needs. Keep in mind that you can customize the template as much as you’d like.
Once you choose a template, you can add your data sources. It’s easier to add Google sources because you just need to authorize Google to pull in data from the property, like YouTube, Google Analytics or Search Console, for example.
If you want to pull in third-party data, from Facebook, Twitter or Bing, for example, you need to use “Community Connectors.” As mentioned earlier, these connectors typically involve a fee, but they are invaluable if you want to pull in data and performance metrics all in one report.
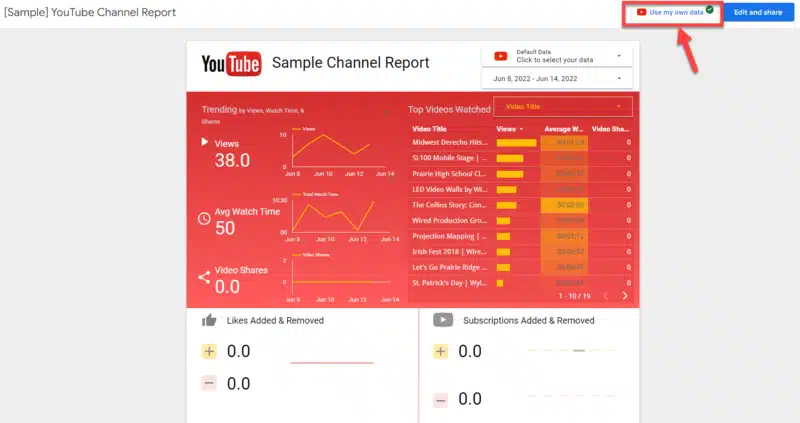
From the template, select “Use my own data.”
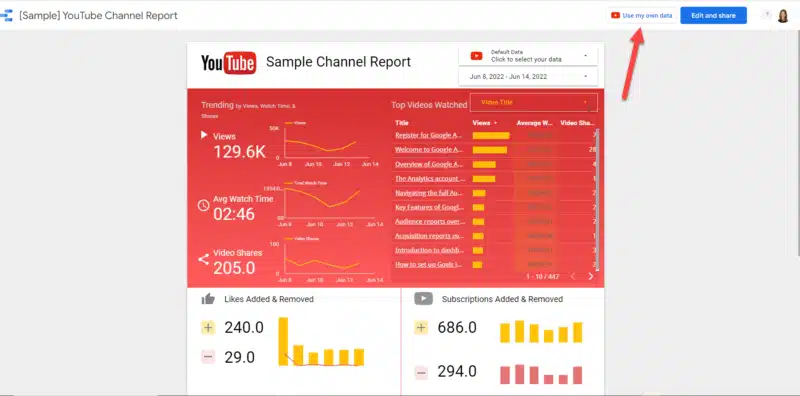
You’ll then be asked to authorize to add the data or use a Community Connector if it’s a third-party tool.
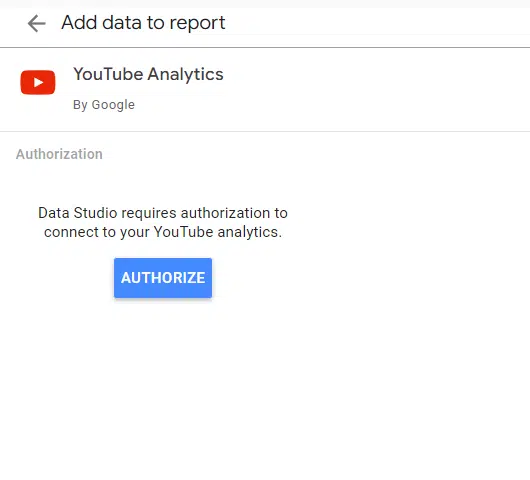
Once the data has been successfully added, you’ll see your information populate the sample report template, and you’ll see a green checkmark next to the “Use my own data” button.
Now you can begin to customize your Looker Studio report by visualizing your data with charts, graphs, tables and more.
Remember to think about who will be reading this report — what data is important to them?
Don’t overload the report with unnecessary information. Think about what story you want your report to tell.
For instance, at the top, you may want to show an “at-a-glance” table that displays the main highlights and then have more detailed stats toward the bottom.
You can also insert videos and text fields to explain what the data shows or how to read the report. You can add more than one page to your report, too.
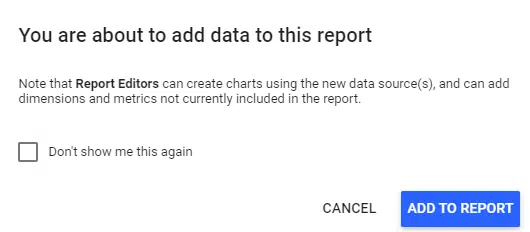
To add data to the report, click the Edit and share button.
You will then be prompted/notified that you are about to add data to the report. Click Add To Report.
You can then start customizing the report by adding available fields, deleting items, adding charts, data, editing and more.
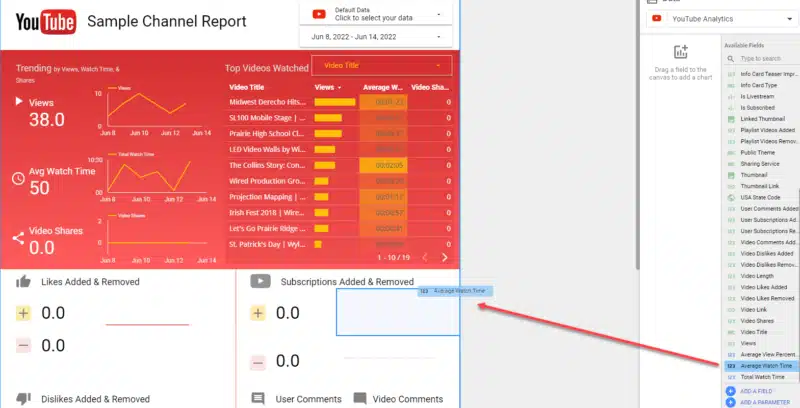

Again, it will take some trial and error before you get the report looking the way you want it to. But practice makes perfect when it comes to Looker Studio reports.
At first, it will be all about experimenting with Looker Studio, so make sure you give yourself plenty of time before your first report is due to the client.
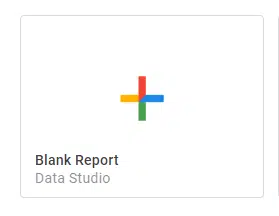
If you want to start a report from scratch, simply click Blank Report:
And select what type of data (“connector”) you’d like to add to the report.
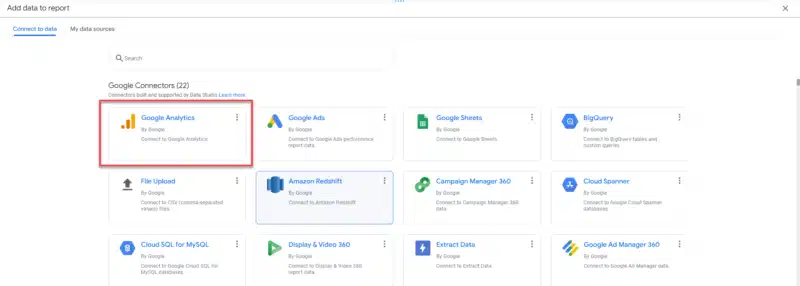
In this example, we’ll select Google Analytics. If you have more than one client that you manage, you’ll need to select the correct client’s Google Analytics Account and click Add.
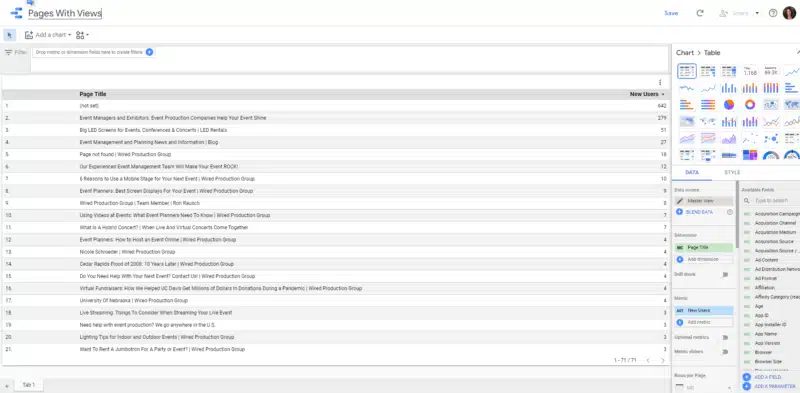
On the right side, you will see all the data sources you can add/manage. If you want to look at these items in greater detail, choose Resources > Manage Added Data Sources and then Edit.

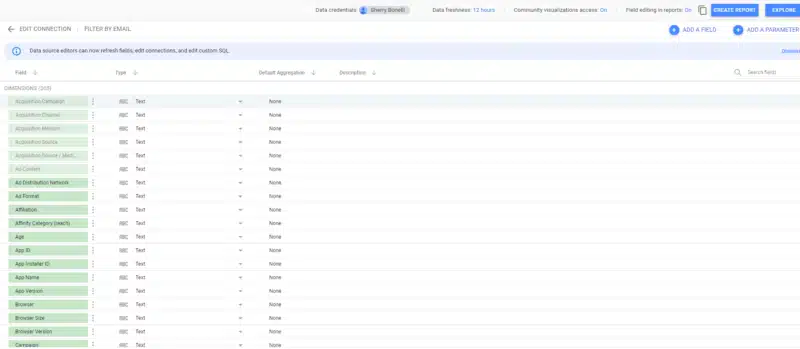
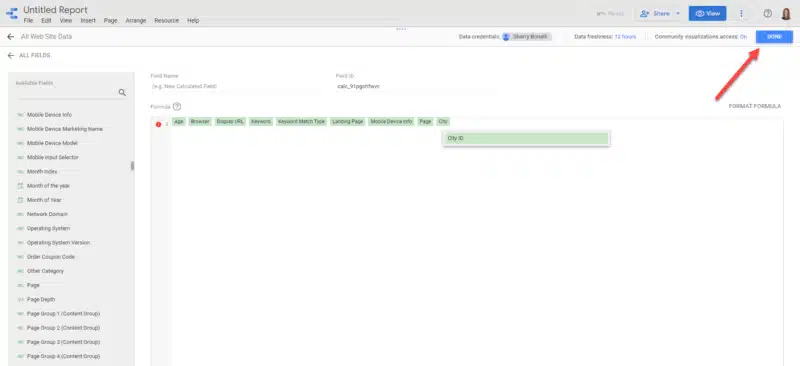
This displays all the different fields you can use for your reports. Click Add a Field to start adding the metrics you’d like to start measuring in your reports.
When you actually click on the Data Source (i.e. Master View in this example) you can see the data source. On this page you can view and edit the data source fields and settings. The fields are the information that will show in your reports.
Remember, if you make changes (like the field name) to the data source, it will affect any of the reports that use this data.
Next to each field, when you click on the three-dots menu, you can make changes to individual fields – like duplicate, hide, remove and more.
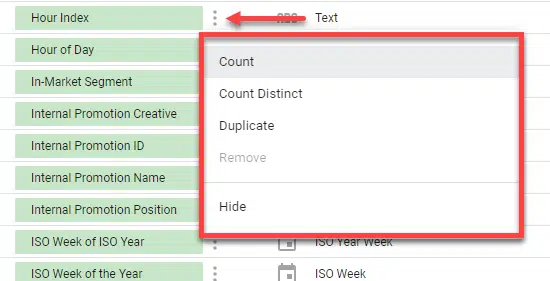
When you are finished, click Done.
If you want to add another data source to this report, like Search Console, for instance, just click Add a Data Source and go through the connecting process like before.
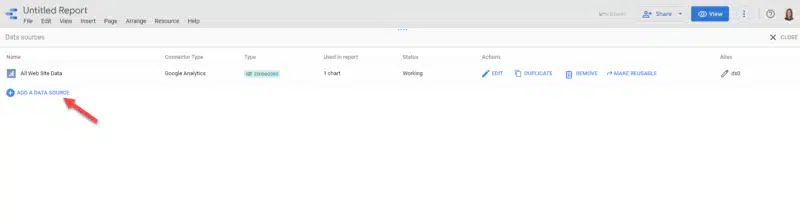
You have plenty of data options to choose from – there are about 500 different connectors!
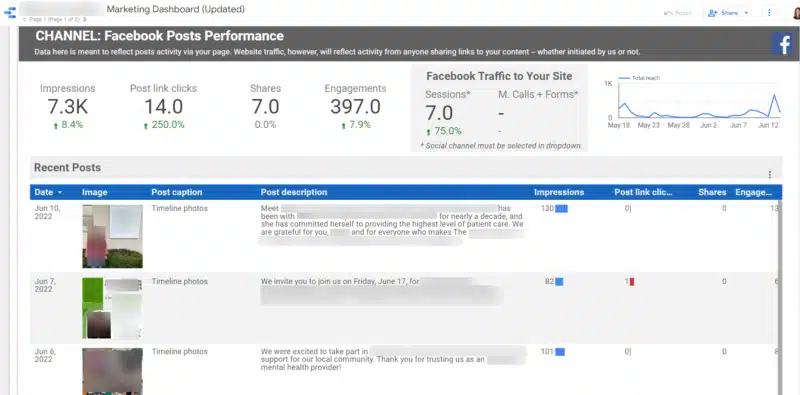
The layout, information and data metrics you can pull into one report is incredible and valuable to anyone who wants to see how their marketing efforts are performing in an easy-to-understand format.
Here are just a few examples of the type of data you can display in reports using Looker Studio:
Demographics
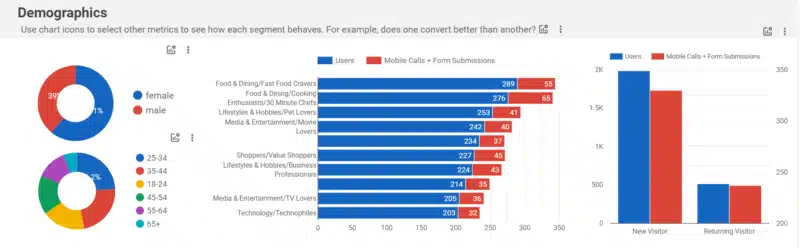
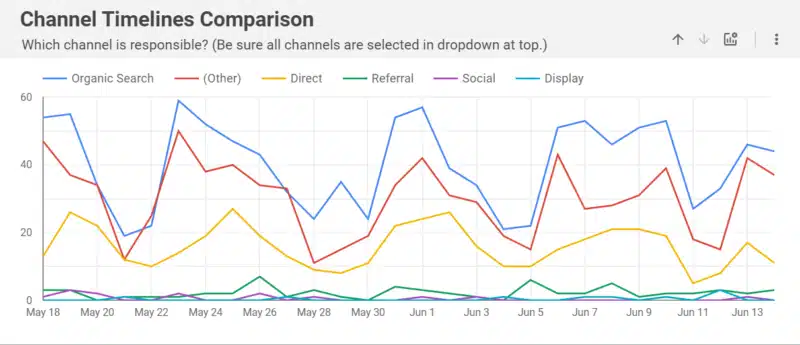
Channel comparison
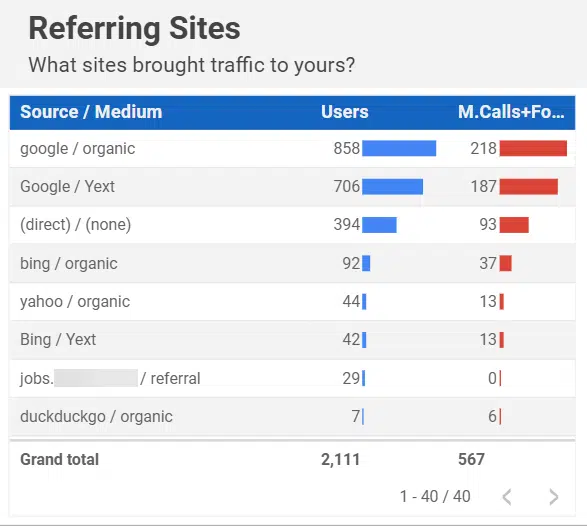
Referring sites
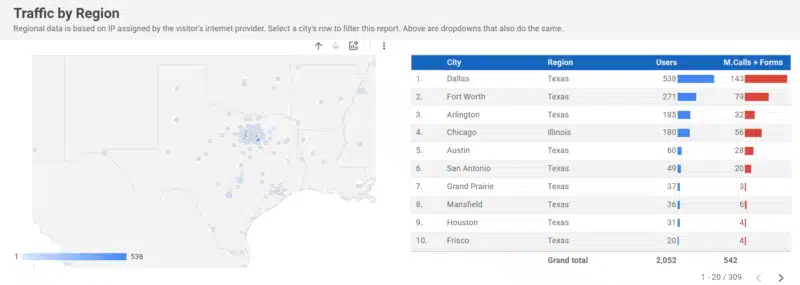
Traffic by region
You will want to play around with your reports, layout and data until you find the best way to visualize and display the data that best represents what you want to show your stakeholders. This will involve some trial and error.
Managing Looker Studio reports
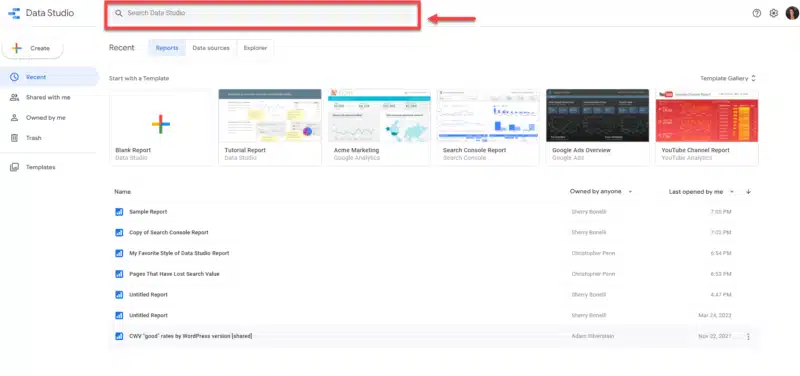
Reports are the thing that make Looker Studio so wonderful! Another way to create a new report is to click on the +Create button in the upper left-hand corner of the home screen and from the drop-down, select Report.


However, once you start creating reports, it can get difficult to manage them.
Use the search feature if you’re unsure the exact name of the report you’re looking for or are having problems finding it.
If you have saved reports, you can click on the menu and either Share, Rename or Remove (Delete) the report.
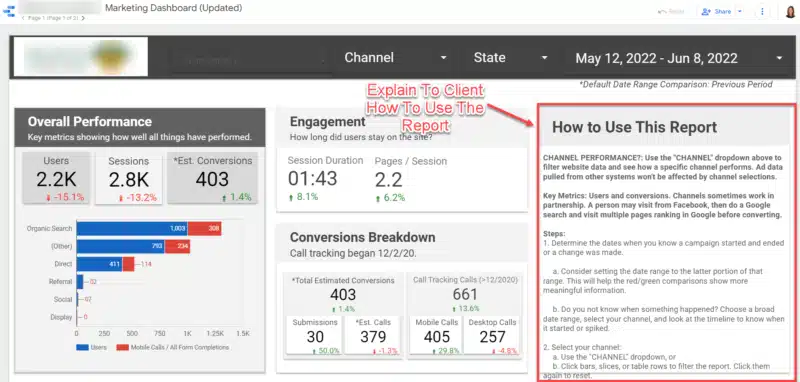
It’s easy for clients to get information overload.
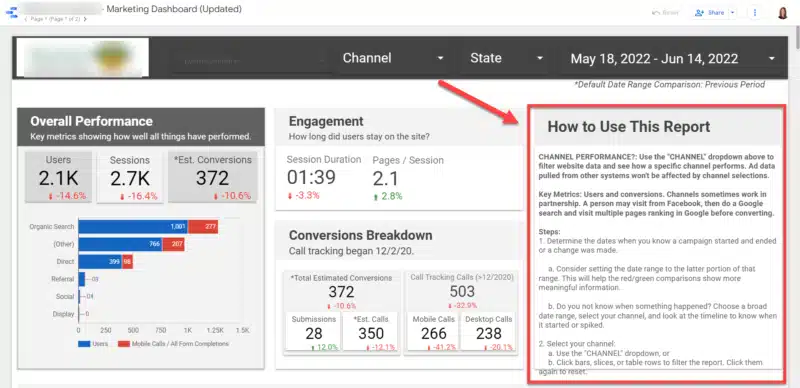
If you provide Looker Studio reports to your clients, it’s nice to provide the client with a section in the report that explains how to read/use the report.
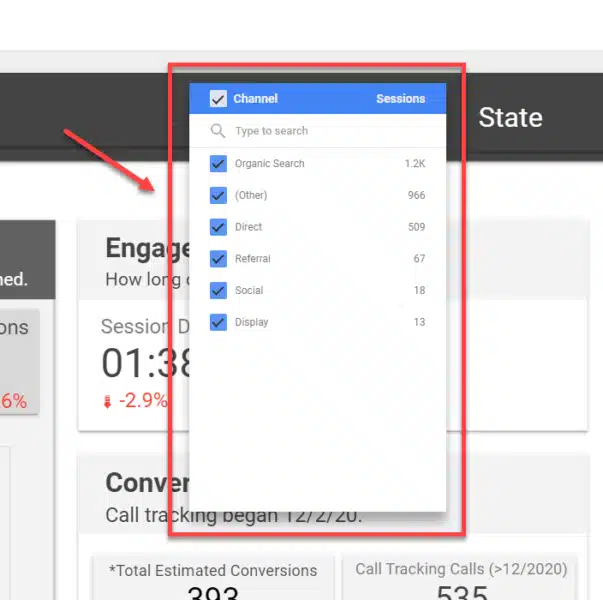
Depending on how you setup your report, you can sort your report in various ways, like by channel. This gives you a clear idea of how each channel is performing.
Sharing your Looker Studio information
The beauty of Looker Studio is you can share what you’re doing with others – whether it’s data source information or reports.
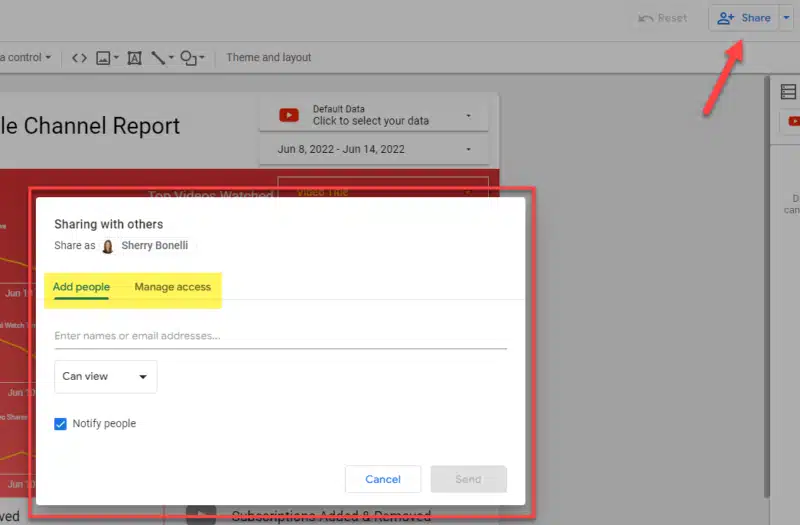
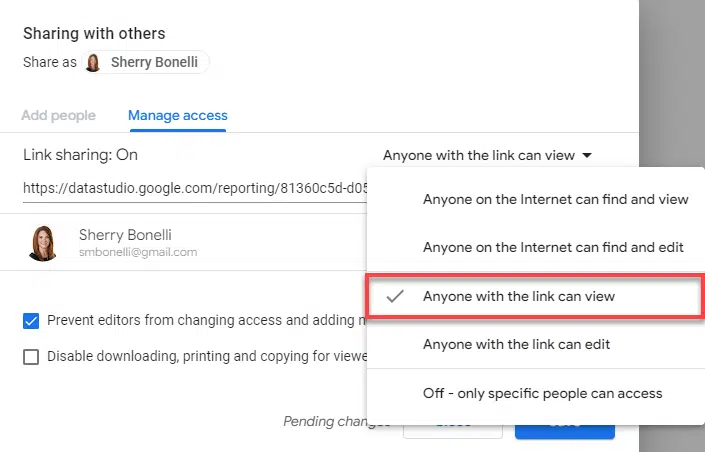
Sharing is easy. Just click on the Share button and then you’ll see the share dialog box.
Go through the prompts and determine what access rights you want to give the people you want to share the information with and add their email addresses.
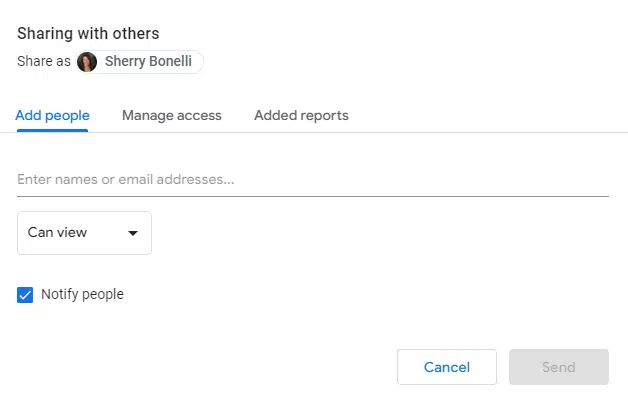
You’ll also be able to determine whether they can simply view the report or if they can make changes. There are other access rights options as well.
Important: only give the appropriate people the rights to actually make changes to your report.
Start using Looker Studio
If you’re the type of person who likes working with spreadsheets, you might not think that Looker Studio is a big deal.
But for the huge number of us who hate spreadsheets, this is a godsend. (Finally! You can take a look at your analytics data — and it makes sense.)
Now, when you’re talking to your clients, you can easily show them the results of your efforts in an easy-to-understand, brandable report.
By sharing these reports with your clients, they will be able to see how your marketing efforts are paying off, which is definitely good for your business.
If you aren’t already using Looker Studio, there’s no better time to start than today so you’ll be ready to share amazing reports with your clients next month.
Opinions expressed in this article are those of the guest author and not necessarily Search Engine Land. Staff authors are listed here.
Related stories
About the author