Weathering the Google storms
Columnist Bobby Lyons explains his method for gauging the impact of a Google algorithm update and using these insights to discover opportunities for improvement.

A good friend of mine and truly the best SEO expert I have had the privilege working with, Gregory Gromov, once referred to the Google algorithm updates and tests as “Google storms.” The coined phrase made all the sense in the world. Per Gregory, a solid SEO program provides the ballast to weather the storm, but if a storm hits and flips you over… well, it is time to right the ship.
A Google algorithm update is actually a rare opportunity. While in some cases it may appear to be more of a nightmare than a dream come true, understanding how to capitalize on the event is key to succeeding in SEO — and as your program matures, you will look forward to the updates.
The following is a process I have used for years to evaluate Google updates at a site level to glean new opportunities for improvement and to determine what is already working. This is a second-level analysis after I have reviewed patterns related to page title, meta description and H1 tags.
The first step in the analysis is establishing the timeline of the update. Search Engine Land usually publishes information quickly when an update is confirmed, so it should be pretty easy to get an approximate date range. Once you have a date range, begin with Google Search Console (GSC) running comparisons within the date range on top pages and determine the date of impact.
After establishing the approximate start date of impact, grab two weeks prior to the date and two weeks from the date forward. Export the data out to Excel, and add a column calculating the change in position between the two weeks. I like to look at positive change first; so, after creating the calculated change column, filter for values greater than 0.

Note: The data represented is sample data compiled for demonstration purposes; the data is not from a live domain.
As we continue the process, we will be pulling data from multiple sources and then combining the data sources to form a full view of all the critical SEO data points. Before we move to the next step, though, we should review the GSC data by itself to see if a pattern exists.
Identifying patterns requires pages that have similar metrics. Add a filter for the range of change that is outside of your normal variation. For example, if your website average position for your high value pages moves up or down between 0.1 and 0.3, as is typical for page 1 rankings, then add a filter to your change column that exceeds the normal variation. For the purposes of my demonstration, we are going to look at ranges between 0.5 and 0.99. A half-position change for a page one position is significant in a two-week time frame.
Now that we have a set of data to analyze, we want to grab a sample of pages that have similar metrics. Pages with similar position change, average position and click-through rates (CTR) make a good sample.
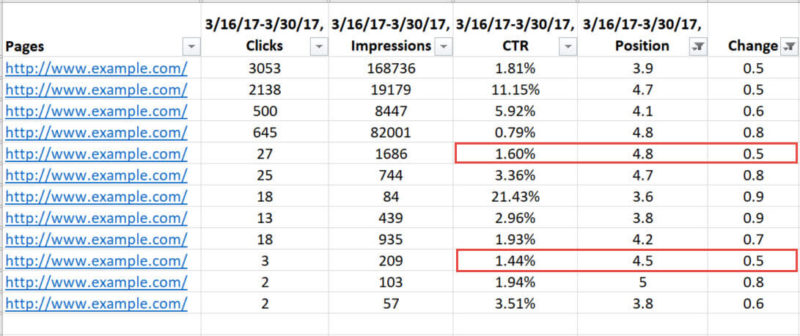
Reviewing the GSC data alone in this demonstration did not produce results. Position changes in the positive range in our data set do not have common data elements on a whole. The CTR variation is significant, which tells us the positive fluctuation was not a result in a weight change in the algorithm related to the CTR… so on to the next step we go.
The next step is to use the crawler of your choice. I prefer Screaming Frog due to the speed of gathering the data. Copy and paste into a text document the list of your URLs that are in the range of change you are analyzing, then perform a crawl on the URLs using the list option in Screaming Frog.
For this pass, we are focused on the data elements from the crawl versus the meta data elements like description, title and so on. The idea here is to just look for data similarities that stand out. We are looking for obvious standouts. Rarely will you find the exact data point you are looking for to correlate to the position change during this step. Typically, it is through the entire process where we find multiple data points that correlate.
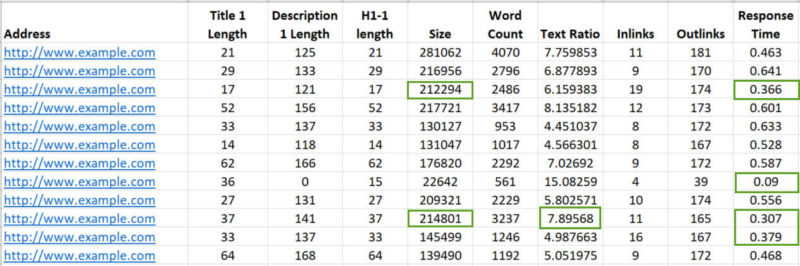
In this example, I found a couple of correlations related to page size and response time. I know this crawl is isolated only to the group of URLs that improved in the range of a half-position, so these correlations are important to set to the side. Now I am at the point where I want to see the full picture of these URLs.
Completing the picture requires exporting engagement metric data from your analytics package. Google Analytics provides this view in the Landing Pages report under Site Content. If you are using Google Analytics, export the data as well from the Site Speed -> Page Timings report. For this data we can use just the two weeks from the date of change.
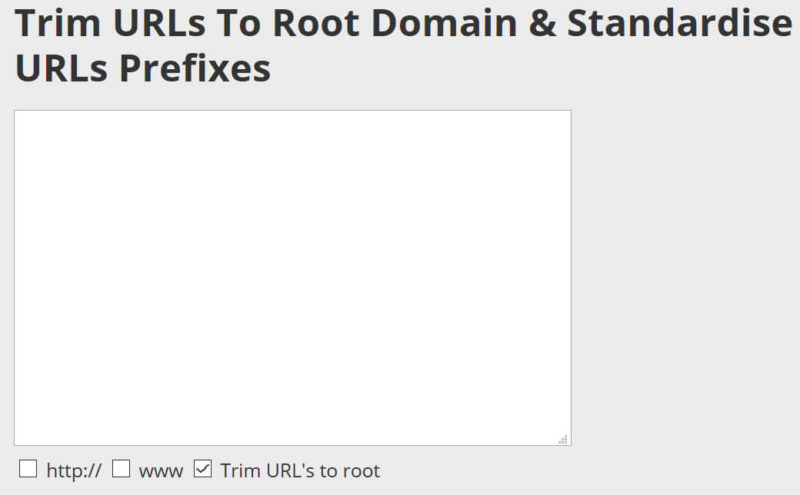
Obtaining the full view of the data requires consolidating the data sources. The issue with data consolidation is that Google does not utilize the same format for URLs across Google Analytics and Google Search Console. Luckily, there is a free tool to standardize the URLs. Simply take the copy and paste the URLs from GSC and Screaming Frog into this tool, and it will strip the URLs down to the root page:
Copy and paste the stripped URLs into the Excel spreadsheet for GSC and Screaming Frog.
If you are working with smaller data sets and/or just prefer to work directly in Excel, you can use the following formula with some minor adjustments to strip the full URL down to the page:
=RIGHT(A3,LEN(A3)-FIND("/",A3,FIND("//",A3)+2))
Combining the data requires linking spreadsheets and performing vlookups — or what I prefer is to use a database tool. With larger data sets, you can use Access and combine the data quickly. Using the URLs as the joining column, you can produce a spreadsheet with all the core data elements you need to find correlations.

Beyond evaluating the data, URLs with similar data points should be evaluated at a page level. For example, is the content in page similar in ratio, and if customer reviews or Q&A are present, are they present in the similar pages in similar volume?
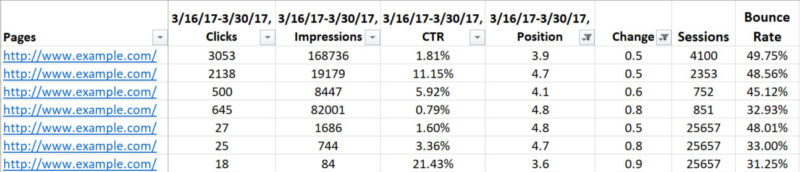
Document all of the metrics that correlate so we can validate the correlations later. In the sample data above there is an important correlation we will want to investigate.

The conclusion we can draw here is that the pages that received a significant positive impact all had two correlating data points. Page load time was below four seconds and bounce rate was below 33 percent.
The last step in this analysis project is to filter the data for negative change and evaluate the pages with significant declines in position and validate the theory that page load time and bounce rate exceeded the values from the positive change data set. If the data demonstrates the negative metrics are on the opposite end of the spectrum, you know exactly what you need to do to bring the negative positions up and improve the pages that improved after the algorithm update even further.
Quality updates are a goldmine for SEO improvement. Next time a verified update rolls out, run the analysis and find the hidden gems.
Contributing authors are invited to create content for Search Engine Land and are chosen for their expertise and contribution to the search community. Our contributors work under the oversight of the editorial staff and contributions are checked for quality and relevance to our readers. The opinions they express are their own.
Related stories
New on Search Engine Land
About the author