Making Strategic Decisions About Difficult-To-Get Backlinks
Looking to start link building? For those not sure where to start, contributor Paul Shapiro presents his method for identifying potential link targets.
Your website’s user experience is top notch, your site architecture is solid, and you’ve created amazing content — now it’s time start building links.
Link building is the subdiscipline of search engine optimization (SEO) that sometimes gets flak due to the practices of some spammers; however, in reality, it is a very important (and effective) aspect of internet marketing. Not only do quality backlinks drive referral traffic, but they are also still the primary factor used to rank a website organically in the Google search results.
But where do you start? What sites do you want links from to boost your rank?
The following methodology will help you evaluate the sites you should be getting links from and strategically choose prospects based on acquisition difficulty and link authority.
Step One: Start With A Broad Search
We’ll start by building a list of relevant, high-quality sites, which we will then assess as possible link targets. Here’s how to do this:
First, search Google for a very broad keyword related to your website. For example, an automaker might search for [cars]; if you are a recipe site, search [recipes]. Since these pages rank for very broad terms, they tend to be higher quality, authoritative sources of links.
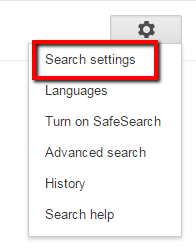
Set Google to show you 50 to 100 search results per page so that you can build a nice, long list. To do this, go the cog on the upper right corner of the search results page and select “Search Settings.”
On the Search Settings page, go to the “Results per page” section and move the slider to the right. (Note: For this option to become available, you may have to set “Google Instant predictions” to “Never show instant results.”)
Once you’ve adjusted your settings, hit the blue “Save” button at the bottom and return to the search results page (SERP).
You should now have a page with 50 to 100 results, depending on where you set the slider.
I recommend downloading a list of these pages to better analyze them. If you do not already have the MozBar installed, add it to your browser. Once it’s installed, click the toolbar icon to enable it on the search results page (You may have to refresh your tab). Click the icon next to the Moz logo to “Export SERP Analysis to CSV.” The only column you will need is the URL column.
Once you have your list of URLs from the SERP, launch Screaming Frog SEO Spider, which will fetch information about outbound links. (The free version should be sufficient for our purposes.) From the top menu, select “Mode->List” and click the “Upload List” button, choosing “Enter Manually…”
Open up your MozBar-generated CSV in Excel, copy the URL column, and paste the values into the Screaming Frog field. Click “okay,” and let Screaming Frog crawl all of those links.
Once the crawl has finished, go to the “Bulk Export” menu, choose “All Outlinks” and save that to your computer.
Open it up in Excel and filter to only the HREF type. Remove any values that were returned false under the “Follow” column. This ensures that links without equity, CSS, Images and JavaScript aren’t considered in our analysis.
Step Two: Google Spreadsheet Wizardry
Head over to Google Drive and open the Screaming Frog export in Google Spreadsheets. (Alternatively, you can use the SEO Tools for Excel add-on.)
Create a column called “Domain Source,” and use the following formula (change B2 to the first value in the “Source” column):
=REGEXEXTRACT(B2,"^https?\:\/\/([^\/?#]+)(?:[\/?#]|$)")
This formula will distill the URLs to the subdomain level.
Now, create another column called “Domain Destination,” and use the following formula (change C2 to the first value in the “Destination” column):
=REGEXEXTRACT(C2,"^https?\:\/\/([^\/?#]+)(?:[\/?#]|$)")
Drag the formula cell down in Excel.
Next, create a column called “Same Domain” with the formula:
=IF(I2=J2,1,0)
Here, I2 should be equal to the first value of “Domain Source,” and J2 should be equal to the first value of “Domain Destination.” As always, drag down. This formula will return “1” if it’s an internal link and “0” if it’s an external link.
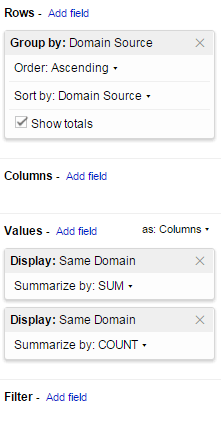
Now, create a pivot table. To do so in Google Spreadsheets, select all the relevant cells and choose “Data->Pivot table.” For Rows, add a field for “Domain Source.” For Values, add two fields: one for “Same Domain” summarized by SUM, and one for “Same Domain” summarized by COUNT.
Next, copy the values of the pivot chart into a new sheet using the “Paste as Values” feature, and delete the “Grand Total” row at the end. Rename “SUM of Same Domain” to “Internal Links” and rename “COUNT of Same Domain” to “Total Links.”
Create a new column called “Percent External” (which represents the percentage of links that are external to that domain); set it equal to Total Links minus Internal Links to get the number of external links, and then divide by Total Links. The formula will look something like this:
=(C2-B2)/C2
We will use this metric to assess how easy or difficult it is to get a link from these domains. If a domain doesn’t link out much, then they are less likely to link out to your site.
Now, find the Domain Authority for these domains. You can use the SEER SEO Toolbox within Google Spreadsheets with an API key, or use a bulk Domain Authority checker like Internut and add it in later. Domain Authority will be the metric we will use as a proxy for link authority.
Step Three: Visualizing Our Link Prospects To Help Make Strategic Decisions
At this point, we can assess how difficult a link is using our “Percent External” column and the authority of the backlink using our “Domain Authority” column. Let’s visualize this so that we can make some quick decisions!
Creating The R Visualization
I prefer to create this visualization in R for aesthetic reasons, but you can also use Excel or Google Spreadsheets.
- Download the spreadsheet as a CSV from Google Drive by selecting “File->Download As->Comma-separated values (.csv, current sheet).”
- Download R and launch the program.
- Install ggplot2 by executing the following command:
install.packages("ggplot2")and then install grid:install.packages("grid") - Finally, we can generate our graph with the following code:
require(ggplot2)

require(grid)

link <- read.csv("C:\\{Directory}\\all_outlinks.csv")

str(link)

qplot(link$Domain.Authority, link$Percent.External, size = link$Domain.Authority, color = link$Domain, label = link$Domain) + geom_hline(yintercept=mean(link$Percent.External), color="red") + geom_vline(xintercept=mean(link$Domain.Authority), color="red") + geom_text(color = "black", size = 2)
NOTES:
- You will have to specify the path of your .csv file. Windows users need to cite directories with a double backslash (i.e., C:\\).
- The column names may vary depending on how you named yours. When you execute
str(link), it will specify how to call these columns in R (see bolded code).
The code will output a chart like this (example for keyword, “SEO”):
Note the four quadrants created by the red lines. The top-right quadrant represents our best link targets. These links have the highest Domain Authority and they also link out the most to external sites. In this example for the keyword “SEO,” we see that seo.alltop.com represents a very good link we should go after because it has a very high Domain Authority and it links out to external domains frequently. Therefore, a link from that domain should be easier to acquire.
Step Four: Start Building Links
Link building is an important part of SEO, but it can be daunting to know where to begin. Using the methodology I’ve outlined will help you make strategic decisions about where to find authority links you actually stand a chance of getting and that make the most sense based on your keywords.
Contributing authors are invited to create content for Search Engine Land and are chosen for their expertise and contribution to the search community. Our contributors work under the oversight of the editorial staff and contributions are checked for quality and relevance to our readers. The opinions they express are their own.
Related stories
New on Search Engine Land


