Adwords For Video Gets Reporting Enhancements
Google has added three new measurement features to the AdWords for video reporting interface. The enhancements are designed to make reporting more goal-oriented and to make it easier to compare campaign performance across platforms and other forms of media. Reach & Frequency Reach and frequency metrics, including Average Impression Frequency and Average View Frequency, have been added […]
Google has added three new measurement features to the AdWords for video reporting interface. The enhancements are designed to  make reporting more goal-oriented and to make it easier to compare campaign performance across platforms and other forms of media.
Reach & Frequency
Reach and frequency metrics, including Average Impression Frequency and Average View Frequency, have been added to the interface to give you more insight into how many unique viewers have seen your ad and the average number of times they’ve seen it. It’s now easier to tell if your ads are getting enough impressions to get noticed but not so many that they are bombarding users.
To view these metrics on a campaign, ad or targeting group level, click on Columns >> Customize Columns and look under the Performance section.
Below is the complete list of metrics now available in the reporting interface.
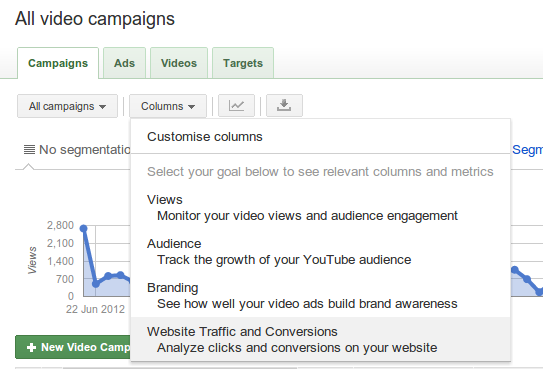
Column Sets Tailored to Marketing Goals
New column sets feature relevant metrics grouped by marketing objective:
- Views: Understand whether viewers watch more of your videos after viewing your paid video ad. Metrics include follow-on views and unique viewers.
- Audience Development: Understand how your video ads drove people to watch and engage with more of your content. Metrics include subscribers and follow-on views.
- Brand Awareness: See how broadly your video ad was viewed. Metrics include unique viewers, average view frequency and average impression frequency.
- Traffic & Conversions: See how your video ads drove viewers to action. Metrics include website traffic, number of conversions, cost-per-conversion, and your conversion rate from people who viewed your ad.

Contributing authors are invited to create content for Search Engine Land and are chosen for their expertise and contribution to the search community. Our contributors work under the oversight of the editorial staff and contributions are checked for quality and relevance to our readers. The opinions they express are their own.
Related stories
New on Search Engine Land

