iPhone vs Android statistics
In the world of smartphones, the rivalry between Apple and Google has been ongoing for years.
Apple offers iPhones with iOS, exclusively available to its smartphones. On the other hand, Android is available on a variety of smartphones from different brands, from budget to premium versions.
There are now more than 1 billion active iPhones and over 3 billion active Android devices.
We’ll explore the latest statistics on iPhone vs Android market share, number of iPhone vs Android smartphone users, iPhone vs Android smartphone sales and more.
iPhone vs Android stats (Highlights)
- As of November 2025, Android has a 72.77% market share worldwide.
- In the US, iPhones hold a market share of 58.13%.
- More than 1 billion iPhones and over 3 billion Android devices are currently active.
- In Q2 2025, Samsung shipped 58 million Android smartphones accounting for a 19.7% market share of the worldwide smartphone market, while Apple delivered 46.4 million iOS devices, capturing 15.7%
iPhone vs Android market share worldwide
According to the latest data, Android dominates the global smartphone market with a 72.77% share, while iPhone (iOS) has a 26.82% market share.

Android accounted for more than half of the mobile operating system market for the first time in 2015, with a 53.65% share at a time and continued its dominance as the most-used mobile operating system among worldwide users.

Here’s a detailed breakdown of iPhone vs Android market share over time:
| Year | iPhone (iOS) | Android |
|---|---|---|
| 2009 | 34.01% | 2.41% |
| 2010 | 25.48% | 8.82% |
| 2011 | 22.29% | 19% |
| 2012 | 24.04% | 27.41% |
| 2013 | 24.03% | 39.21% |
| 2014 | 23.95% | 53.65% |
| 2015 | 20.2% | 64.2% |
| 2016 | 19.29% | 69.11% |
| 2017 | 19.65% | 72.63% |
| 2018 | 20.47% | 75.45% |
| 2019 | 22.71% | 75.47% |
| 2020 | 26.28% | 73.06% |
| 2021 | 27.34% | 71.89% |
| 2022 | 27.85% | 71.47% |
| 2023 | 29.02% | 70.26% |
| 2024 | 27.81% | 71.56% |
| 2025 | 26.82% | 72.77% |
Source: StatCounter
iPhone vs Android market share in the US
In 2025, iPhone is leading the mobile market in the US with a market share of 58.13% vs. 41.61% for Android phones.

Android had the highest recorded market share of 46.42% in 2015 (vs. 50.85% for iPhone/iOS).

Here’s a table with recent data on iPhone/iOS vs. Android market share in the US since 2009:
| Year | iPhone (iOS) | Android |
|---|---|---|
| 2009 | 57.9% | 6.16% |
| 2010 | 38.31% | 18.71% |
| 2011 | 38.33% | 35.32% |
| 2012 | 49.48% | 40.63% |
| 2013 | 52.79% | 39.25% |
| 2014 | 52.3% | 42.58% |
| 2015 | 50.85% | 46.42% |
| 2016 | 53.19% | 45.2% |
| 2017 | 53.89% | 45.23% |
| 2018 | 54.82% | 44.73% |
| 2019 | 55.23% | 44.51% |
| 2020 | 59.54% | 40.27% |
| 2021 | 58.58% | 41.11% |
| 2022 | 56.74% | 42.94% |
| 2023 | 58.1% | 41.46% |
| 2024 | 56.52% | 43.18% |
| 2025 | 58.03% | 41.71% |
Source: StatCounter
iPhone vs Android smartphone users in the US
An estimated 133.4 million individuals in the US own an Android smartphone in the US, while the number of iPhone users in the US stands at 118.1 million.
Note: Data as of 2022.
Source: eMarketer
iPhone vs Android smartphone sales worldwide
As of Q3 2025, Android smartphones accounted for 79% of quarterly worldwide smartphone sales, while iPhone smartphones market share reached 17% in the same quarter.

Source: Kantar
iPhone vs Android smartphone sales in select countries
According to Q3 2024 smartphone sales Kantar data, Android market share exceeded iPhone in all markets included in the analysis.
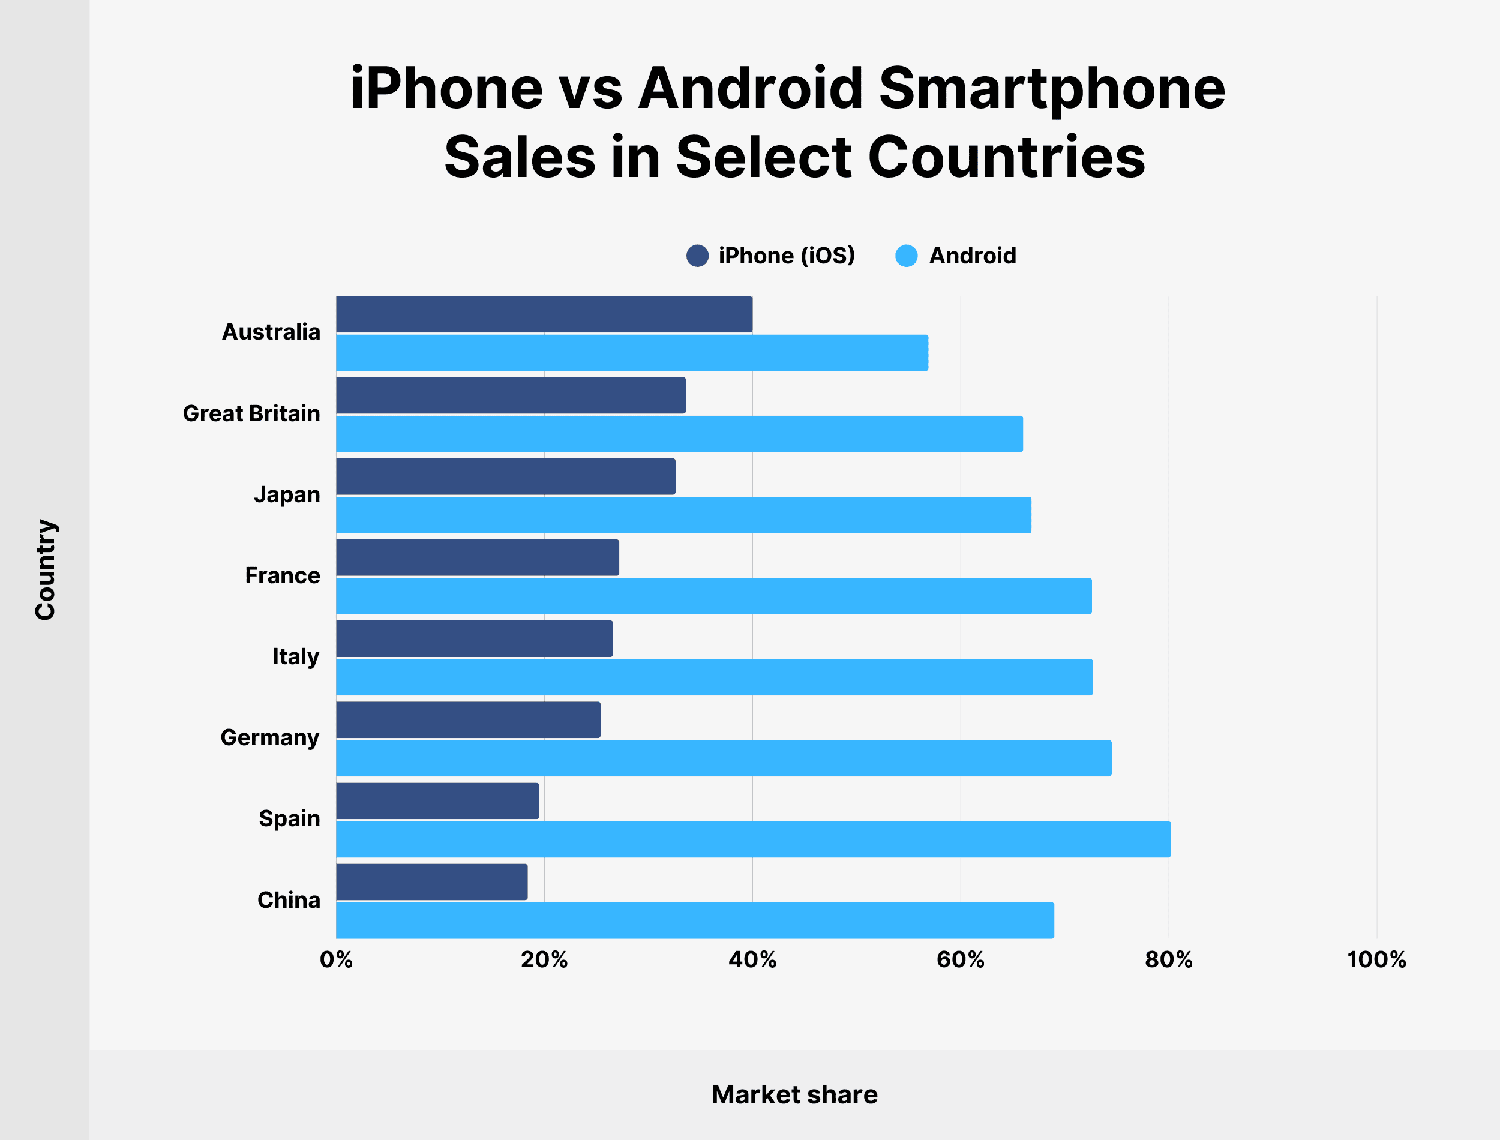
Here’s the latest data with iPhone and Android market share in 9 select markets:
| Country | iPhone (iOS) | Android |
|---|---|---|
| Australia | 40% | 52.2% |
| Great Britain | 56.9% | 54.5% |
| Japan | 33.6% | 66% |
| France | 32.6% | 66.8% |
| Italy | 27.2% | 72.6% |
| Germany | 26.6% | 72.7% |
| Spain | 25.4% | 74.5% |
| China | 18.4% | 69% |
Source: Kantar
Number of available apps for iPhone vs Android
Around 1.55 million apps are currently available for iPhone users worldwide to download in the App Store. The number of available apps in the Google Play Store for Android users stands at 1.68 million.
Sources: Statista 1, Statista 2
iPhone vs Android app spending
Consumer spending (including paid apps, in-app purchases, subscriptions) on the App Store for iPhone users is forecasted to reach $142 billion in 2025, while app spending amounts to $65 billion on Google Play for Android users in 2025.

Spending on iPhone users accounted for 68.6% of all consumer spending on mobile apps, while Android remained with a 31.4% share of app spending worldwide in 2025.
Here’s a detailed breakdown of consumer spending on mobile apps across the App Store and Google Play since 2021:
| Year | App Store (iPhone) Spending | Google Play (Android) Spending |
|---|---|---|
| 2021 | $85 billion | $47 billion |
| 2022 | $92 billion | $45 billion |
| 2023 | $108 billion | $51 billion |
| 2024 | $124 billion | $58 billion |
| 2025 | $142 billion | $65 billion |
| 2026 | $161 billion | $72 billion |
Source: Sensor Tower
Best-selling smartphones on Android vs iOS (iPhone)
According to Counterpoint Research, 5 of the top 10 best-selling smartphones worldwide are iPhone models operating on iOS, while the other 5 are Samsung and Xiaomi smartphones running on the Android operating system.

Here’s a complete list of best-selling smartphones by operating system (as of Q2 2025):
| Smartphone, Rank | Operating System |
|---|---|
| 1. iPhone 16 | iOS |
| 2. iPhone 16 Pro Max | iOS |
| 3. iPhone 16 Pro | iOS |
| 4. Galaxy A16 5G | Android |
| 5. Galaxy A06 4G | Android |
| 6. iPhone 16e | iOS |
| 7. Galaxy A16 4G | Android |
| 8. Galaxy S25 Ultra | Android |
| 9. Redmi 14C 4G | Android |
| 10. iPhone 15 | iOS |
Source: Counterpoint Research
Conclusion
You’ve reached the end of my iPhone vs Android statistics for 2025.
It’s clear that Android smartphones dominate the global smartphone market, but iPhones remain popular in many markets.
Furthermore, iPhone users tend to spend more on mobile apps compared to Android users.
It will be interesting to see how it evolves over time and whether Android will sustain its leading position as the most used mobile operating system.
Explore more on
Editorial disclosure
Search Engine Land is owned by Semrush. We remain committed to providing high-quality coverage of marketing topics. Unless otherwise noted, this page’s content was written by either an employee or a paid contractor of Semrush Inc.
About the author
