iPhone users and sales stats
Apple’s iPhone claims an 18.7% market share of the global smartphone market, ranking as one of the leading smartphone brands worldwide.
Introduced in 2007 by Steve Jobs, the iPhone has seen at least 190 million annual shipments each year since 2014.
Continue reading to find the latest iPhone stats for 2026.
iPhone key stats
- More than 1.561 billion consumers currently use iPhones.
- Apple shipped 225.7 million iPhones in 2024.
- iPhones have a 54% share of smartphone sales in the US.
- 5 of the top 10 most sold smartphone models in Q1 2025 were designed by Apple.
iPhone users worldwide
According to the latest update, there are an estimated 1.561 billion active iPhone users worldwide. That’s an increase of 3.6% over the past year.
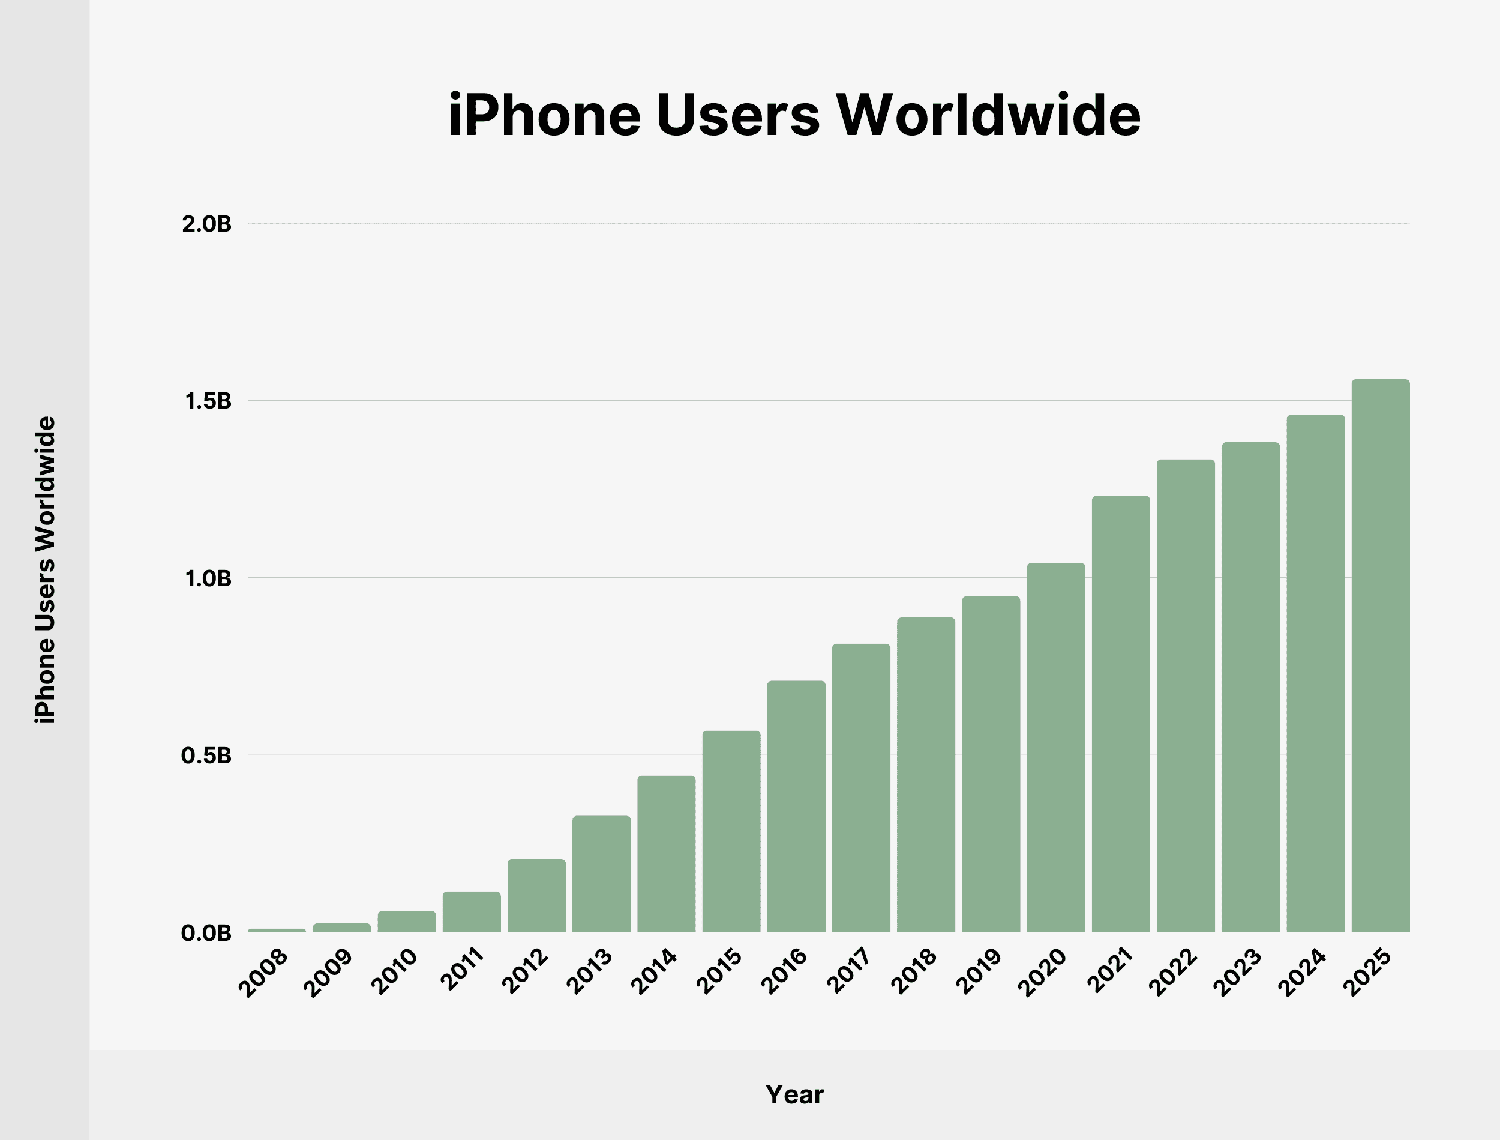
Apple hit a milestone of over 1 billion active iPhone units in 2020.
Here’s a table with the total number of iPhone users since 2008:
| Year | iPhone Users Worldwide |
|---|---|
| 2008 | 10 million |
| 2009 | 25 million |
| 2010 | 60 million |
| 2011 | 115 million |
| 2012 | 206 million |
| 2013 | 329 million |
| 2014 | 442 million |
| 2015 | 569 million |
| 2016 | 710 million |
| 2017 | 814 million |
| 2018 | 888 million |
| 2019 | 948 million |
| 2020 | 1.042 billion |
| 2021 | 1.231 billion |
| 2022 | 1.334 billion |
| 2023 | 1.382 billion |
| 2024 | 1.462 billion |
| 2025 | 1.561 billion |
Source: Statista
iPhone users in the US
There are an estimated 150.7 million iPhone users in the US. The active iPhone user base grew by 5.16% over the past year.

Here’s a table with the total number of iPhone users in the US since 2012:
| Year | iPhone Users in the US |
|---|---|
| 2012 | 44.53 million |
| 2013 | 57.78 million |
| 2014 | 72.3 million |
| 2015 | 82.5 million |
| 2016 | 90.1 million |
| 2017 | 97.2 million |
| 2018 | 101.9 million |
| 2019 | 105.2 million |
| 2020 | 113.5 million |
| 2021 | 116.3 million |
| 2022 | 124.7 million |
| 2023 | 130.1 million |
| 2024 | 143.3 million |
| 2025 | 150.7 million |
iPhone shipment volumes
Apple delivered 225.7 million iPhones in 2024. Sales declined compared to the 231.8 million shipped iPhones in 2023.

To date, the annual all-time high volume of 233.9 million shipments was achieved in 2021.
We’ve charted annual iPhone shipments since 2010:
| Year | iPhone Shipments |
|---|---|
| 2010 | 47.4 million |
| 2011 | 93.1 million |
| 2012 | 135.8 million |
| 2013 | 153.4 million |
| 2014 | 192.7 million |
| 2015 | 231.5 million |
| 2016 | 215.4 million |
| 2017 | 213.3 million |
| 2018 | 208.8 million |
| 2019 | 191 million |
| 2020 | 206.1 million |
| 2021 | 233.9 million |
| 2022 | 225.3 million |
| 2023 | 231.8 million |
| Q1 2024 | 50.1 million |
| Q2 2024 | 45.2 million |
| Q3 2024 | 56 million |
| Q4 2024 | 74.7 million |
| Q1 2025 | 54.7 million |
| Q2 2025 | 51.7 million |
Sources: Statista, BusinessWire
iPhone market share worldwide
iPhones accounted for 17% of global smartphone shipments in Q2 2025. That’s a decrease from 19% in the previous quarter.
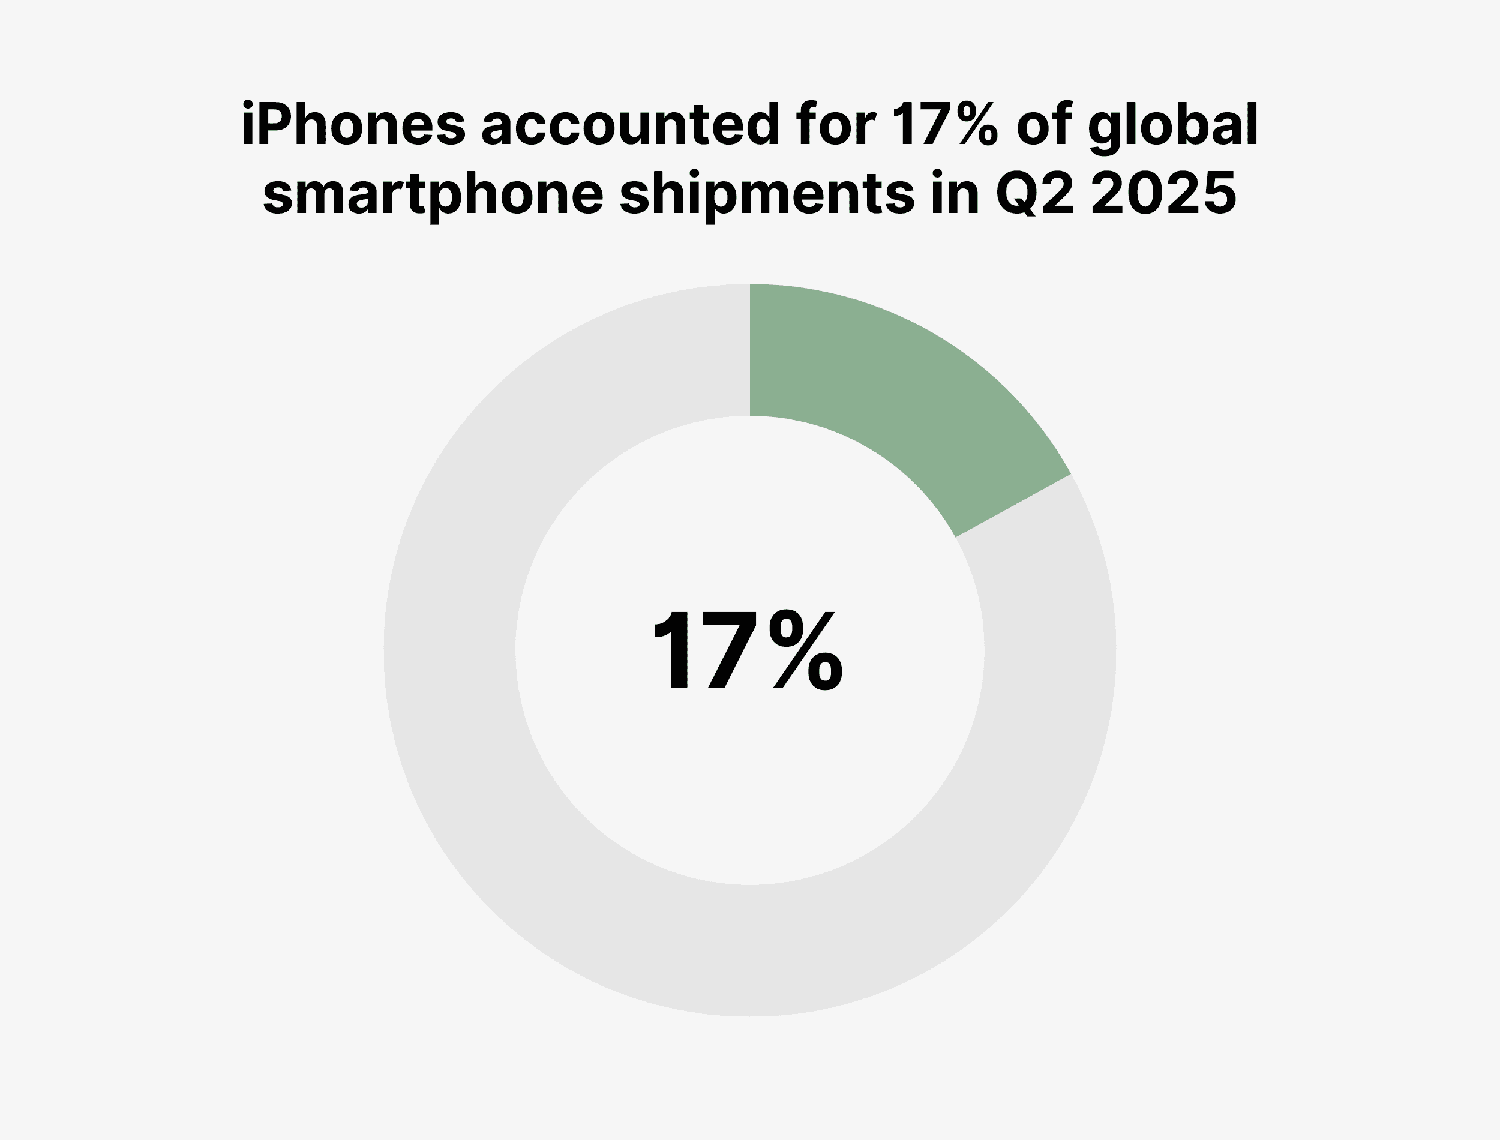
We’ve charted the iPhone’s market share of worldwide smartphone shipments since Q1 2022:
| Date | iPhone Worldwide Market Share |
|---|---|
| Q1 2021 | 17% |
| Q2 2021 | 15% |
| Q3 2021 | 14% |
| Q4 2021 | 22% |
| Q1 2022 | 18% |
| Q2 2022 | 16% |
| Q3 2022 | 16% |
| Q4 2022 | 24% |
| Q1 2023 | 21% |
| Q2 2023 | 17% |
| Q3 2023 | 16% |
| Q4 2023 | 23% |
| Q1 2024 | 17% |
| Q2 2024 | 16% |
| Q3 2024 | 17% |
| Q4 2024 | 23% |
| Q1 2025 | 19% |
| Q2 2025 | 17% |
Source: Counterpoint Research
iPhone US market share
iPhones accounted for 54% of smartphone shipments in the United States in Q2 2025.

Market share fluctuates based on the releases of new models by Apple and its competitors.
Here’s a table showing the iPhone’s share of US smartphone sales since Q1 2016:
| Date | iPhone US Market Share |
|---|---|
| Q1 2016 | 33% |
| Q2 2016 | 30% |
| Q3 2016 | 34% |
| Q4 2016 | 39% |
| Q1 2017 | 33% |
| Q2 2017 | 29% |
| Q3 2017 | 34% |
| Q4 2017 | 45% |
| Q1 2018 | 37% |
| Q2 2018 | 40% |
| Q3 2018 | 39% |
| Q4 2018 | 47% |
| Q1 2019 | 39% |
| Q2 2019 | 41% |
| Q3 2019 | 42% |
| Q4 2019 | 49% |
| Q1 2020 | 46% |
| Q2 2020 | 46% |
| Q3 2020 | 40% |
| Q4 2020 | 65% |
| Q1 2021 | 55% |
| Q2 2021 | 53% |
| Q3 2021 | 47% |
| Q4 2021 | 56% |
| Q1 2022 | 50% |
| Q2 2022 | 48% |
| Q3 2022 | 50% |
| Q4 2022 | 57% |
| Q1 2023 | 52% |
| Q2 2023 | 55% |
| Q3 2023 | 53% |
| Q4 2023 | 62% |
| Q1 2024 | 52% |
| Q2 2024 | 52% |
| Q3 2024 | 53% |
| Q4 2024 | 65% |
| Q1 2025 | 57% |
| Q2 2025 | 54% |
Sources: Statista, Counterpoint Research
iPhone China market share
Apple’s iPhone held a 15.5% share of the Chinese smartphone market in 2024. That’s an increase from 17.3% in 2023.
In Q2 2025, iPhone accounted for a 15% share of the smartphone market in China.

Here’s a table showing the iPhone’s share of smartphone shipments in China since 2014:
| Date | iPhone China Market Share |
|---|---|
| 2014 | 8.8% |
| 2015 | 13.6% |
| 2016 | 9.6% |
| 2017 | 9.3% |
| 2018 | 9.1% |
| 2019 | 8.9% |
| 2020 | 11.1% |
| 2021 | 15.3% |
| 2022 | 16.8% |
| 2023 | 17.3% |
| Q1 2024 | 15.7% |
| Q2 2024 | 15.5% |
| Q3 2024 | 14% |
| Q4 2024 | 17% |
| Q1 2025 | 15% |
| Q2 2025 | 15% |
Source: Statista, Counterpoint Research 1, Counterpoint Research 2, Counterpoint Research 3
What are the top-selling smartphones?
In Q1 2025, Apple took 5 spots in the list of the top 10 best-selling smartphones.
Here’s a complete ranking:
- iPhone 16
- iPhone 16 Pro Max
- iPhone 16 Pro
- iPhone 15
- Galaxy A16 5G
- Galaxy A06
- Galaxy S25 Ultra
- Redmi 14C 4G
- Galaxy A55 5G
- iPhone 16 Plus
Per sales data from 2024, Apple accounted for 6 of the top 10 best-selling smartphones.
Here’s a list of the top 10 best-selling smartphone models in 2024:
| Smartphone Model | Market Share |
|---|---|
| iPhone 15 | 4.4% |
| iPhone 15 Pro Max | 4.3% |
| iPhone 15 Pro | 3.7% |
| Galaxy A15 5G | 1.9% |
| iPhone 16 Pro Max | 1.9% |
| Galaxy A15 4G | 1.5% |
| Galaxy S24 Ultra | 1.4% |
| iPhone 14 | 1.3% |
| iPhone 16 Pro | 1.1% |
| Galaxy A05 | 1.0% |
Sources: Counterpoint Research 1, Counterpoint Research 2
iOS market share
iOS holds a 27.81% worldwide share of the mobile operating system market. That’s down from 29.02% in 2023.

Android accounts for the vast majority of the remainder of the mobile OS market, holding a 71.56% share.
Here’s a table with the global iOS market share since 2010:
| Year | iOS Market Share |
|---|---|
| 2010 | 25.48% |
| 2011 | 22.29% |
| 2012 | 24.04% |
| 2013 | 24.03% |
| 2014 | 23.95% |
| 2015 | 20.2% |
| 2016 | 19.29% |
| 2017 | 19.65% |
| 2018 | 20.47% |
| 2019 | 22.71% |
| 2020 | 26.28% |
| 2021 | 27.34% |
| 2022 | 27.85% |
| 2023 | 29.02% |
| 2024 | 27.81% |
Source: Statcounter
Conclusion
That’s all for my collection of iPhone stats for 2026. Hopefully, you found the data interesting.
Apple continues to strengthen its standing in the smartphone market. The brand has risen to a position of particular dominance in the US.
Explore more on
Editorial disclosure
Search Engine Land is owned by Semrush. We remain committed to providing high-quality coverage of marketing topics. Unless otherwise noted, this page’s content was written by either an employee or a paid contractor of Semrush Inc.
About the author


