How Much Is A Click Really Worth?
All forms of paid advertising use the max bid – it’s the most basic concept yet calculating the theoretical maximum value to pay for a click is surprisingly difficult. It’s not that the math is tough; it just takes stepping back from the granularity of channel specific optimization to get a more holistic look at […]
All forms of paid advertising use the max bid – it’s the most basic concept yet calculating the theoretical maximum value to pay for a click is surprisingly difficult. It’s not that the math is tough; it just takes stepping back from the granularity of channel specific optimization to get a more holistic look at how marketing channels interact with each other.
Looking at one marketing channel at a time provides incomplete insight into performance yet, ironically, many businesses split management of channels across multiple teams and incentivize marketing mangers on performance leading to internal competition for the same conversions.
For example, let’s consider a Google paid search account over the course of Q4 2011. AdWords gives us the basics key performance indicators:
![]()
Because AdWords (or any other channel using a proprietary cookie/pixel based tracking system) takes credit for all conversions that were touched by a Google paid search click at some point in the conversion funnel, conversion values reported in AdWords always skew high.
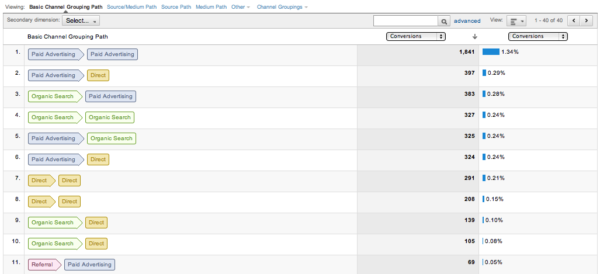
If we compare the same date set within our analytics platform, you will see dramatically different results:
![]()
In this case, the conversion count in analytics is significantly lower (about 33%) – enough to make the channel appear unprofitable. This is due to a last entry attribution model that is used by default in most analytics platforms.
So which one is right? It depends on how we want to interpret the data…
What distinguishes an analytics platform from is that it monitors multiple referring channels whereas a channel specific platform (eg AdWords) operates in it’s own little world without any insight or concern for other marketing channels with respect to conversion counting.
This often leads to double counting of conversions if we were to add up conversion counts across all paid traffic channels (AdWords, AdCenter, Facebook ads, etc.).
As a result, most analytics system offer some form of a multi-channel attribution system or conversion funnel. Whether it’s a slick visual graph like in Google Analytics (below) or a simple linear attribution report as provided by Omniture, the idea is to identify the true value of a click or a visit by parsing the value of each conversion across all touch points leading up to the conversion.
In order to identify the true value of a click from a given marketing channel, we need to gather some channel specific data:
- Clicks
- Conversions
- Average Order Value
- Number of Channels per conversion
Note: I prefer to use an average order rather than revenue in order to normalize the potential effect of a large order skewing data.
Clicks and average order value can come directly from analytics or the channel tool. Conversion count comes from isolating the number of conversions attributed to the channel through the dividing the number of conversions by the number of unique channels associated with each conversion.
To get these numbers, we need to use the multi-channel conversion funnel report and a few different attribution models:
- First Click
- Last Click
- Linear
By multiplying AOV and conversion count (for the two high and low attribution models with respect to conversion count) and then dividing by the number of clicks we can get a range for revenue per click.
Consider the following conversion count per attribution model:
- Last Click: 2,975
- First Click: 2,399
- Linear: 2,203
The high is last click (2,975 attributed conversions) and the low is Linear (2,203 attributed conversions). Running the calculations:
(2,975 conversions x $25) / 27,348 clicks = $2.01 / click
(2,203 conversions x $25) / 27,348 clicks = $2.72 / click
This tells us that we can afford an average CPC between $2.01 – $2.72 for Google paid search to run at break-even profitability.
The value of a click is completely dependent on the average order value. If your business has significant seasonal fluctuation in terms of search volume, competition, and/or average order values, I strongly recommend running through this exercise multiple times per year in order to best understand the current max bids to operate a profitable marketing campaign.
Contributing authors are invited to create content for Search Engine Land and are chosen for their expertise and contribution to the search community. Our contributors work under the oversight of the editorial staff and contributions are checked for quality and relevance to our readers. The opinions they express are their own.
Related stories
New on Search Engine Land
About the author