Opinions expressed in this article are those of the sponsor. Search Engine Land neither confirms nor disputes any of the conclusions presented below.
Optimizing Largest Contentful Paint: 5 tips for a faster website
Learn new techniques to speed up your website and pass Google’s Core Web Vitals assessment.

Page speed is important for a good user experience.
Google’s Core Web Vitals metrics also can impact organic search rankings.
This article will review some new and less well-known approaches to make your website faster.
What is Largest Contentful Paint?
Largest Contentful Paint (LCP) measures how soon visitors can see the main content after opening a webpage.
LCP is one of three Core Web Vitals metrics used to assess a webpage’s performance. The other Core Web Vitals are:
- Cumulative Layout Shift (CLS), which measures layout stability.
- Interaction to Next Paint (INP), which measures how quickly the page responds to user interactions.
Google defines thresholds for each metric that websites need to hit to get a ranking boost.

Here are a few techniques you can use to improve your LCP scores.
1. Add speculation rules to your website
Hopefully, many of your visitors navigate around your website to explore all your business has to offer.
Speculation rules are a new browser feature that makes it easy to optimize these later pageviews. They allow websites to proactively load other pages on your website before the visitor opens them.
For example, after a visitor reads a blog post they might check out your homepage next, or go to a signup page. Those navigations can be instant if these pages are pre-rendered using speculation rules. That means your LCP score will be below 100 milliseconds.
Adding speculation rules to your website is easy. Just add a script tag like this to your website:
<script type="speculationrules">
 {
   "prerender": [
     {
       "urls": ["/", "/signup"]
     }
   ]
 }
</script>
2. Optimize LCP with real user data
There are a lot of website performance testing tools, including PageSpeed Insights and DebugBear’s free website speed test.
These tools run what’s called a lab test: the page is opened in a controlled testing environment where a performance measurement is taken.
However, sometimes the lab-based LCP values won’t match real user experiences. This can happen for a number of reasons, including:
- Lab tests might hit a cache while most users need data to be regenerated.
- Many real users are logged in and experience slower page loads.
- Real users have different network and device speeds from the lab environment.
- Visitors have a different device size from the lab test.
Real website visitors also have diverse experiences. Optimizations that work well for one visitor segment might not work well for another.
Here a real user monitoring (RUM) tool can help you better understand what’s happening on your website and which optimizations will have the biggest impact.
For example, RUM data can tell you what page elements are responsible for the LCP rendering milestones. This will vary between visitors, and knowing what LCP elements need to be optimized provides the foundation for a good LCP score.

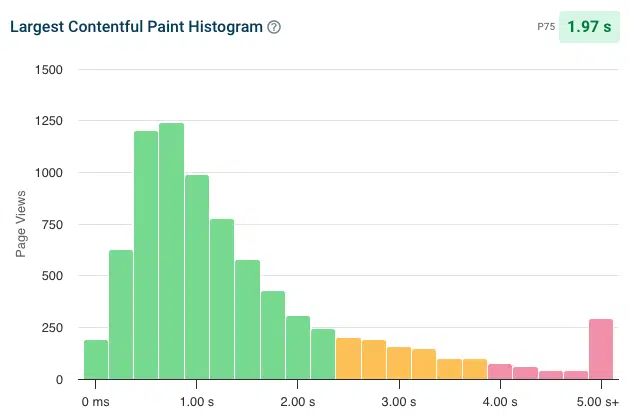
When Google reports real user page speed it looks at the 75th percentile value. For example, if your LCP score is 3 seconds, that means that 75% of your users waited less than 3 seconds for the main page content, and 25% waited longer than that.
However, this is just an aggregate value. Some visitors might wait 5 seconds or more – and these people will likely bounce.
Real user monitoring can give you a more detailed breakdown of how different visitors experience your website. For example, by showing a histogram for each of the Core Web Vitals metrics. You can also look at specific visitor experiences to optimize them.
We’ve already seen that visitor devices have a big impact on your website’s LCP score.
Depending on the screen size of each website visitor, different content will be visible above the fold, and images will be displayed at different sizes.
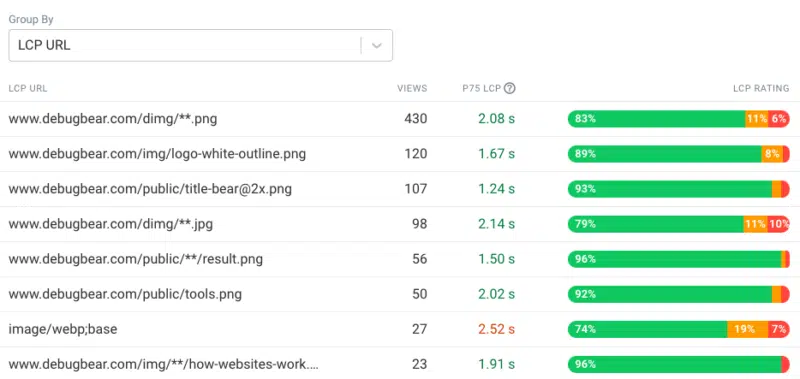
The LCP image can vary between visitors – even on the same page.
Lab tests always use the same screen size, but real user data captures the variety of devices used to access your website.
Real user monitoring data can therefore show you exactly what images on your website are loading slowly most often and need to be optimized.
3. Identify slow LCP subparts
Four things need to happen to display an LCP image on your website. These LCP subparts are:
- Time to First Byte: How quickly does the server respond to the initial document request?
- Resource Load Delay: How quickly does the browser discover the LCP image?
- Resource Load Time: How long does it take to download the LCP image?
- Render Delay: Does the LCP image show up immediately after loading or is there a delay?
Many page speed tools are built on Google’s free Lighthouse test, including PageSpeed Insights. Here, in the Diagnostics section, you can find details on the Largest Contentful Paint element. Below the element preview Lighthouse shows the LCP subpart breakdown.
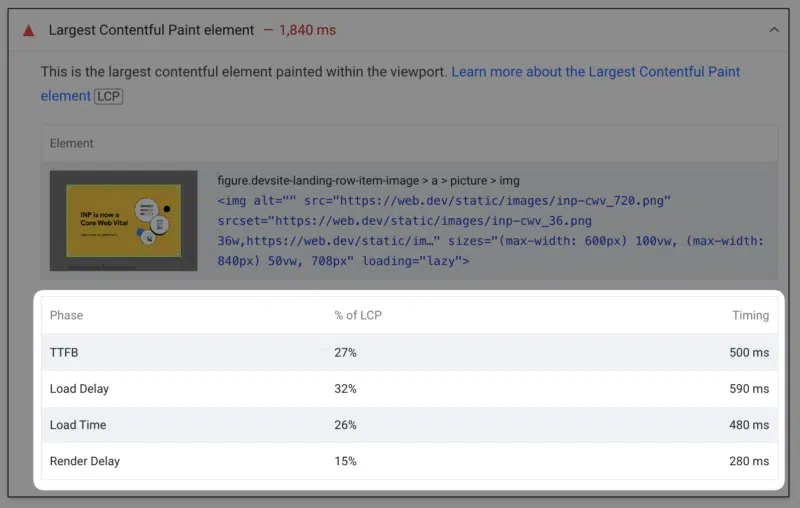
Depending on what LCP component contributes the most to your overall score, different optimizations will make sense for your website.
For example, if Load Time is high, that would suggest that you have a large image on your website that takes a long time to download. In that case, resizing the image or using a modern image format like WebP would be a promising optimization.
However, Google recently published an article on common misconceptions about how to optimize the LCP metric that found:
- Load Time often isn’t a big factor.
- Other subparts like TTFB and Load Delay play a bigger role in improving LCP.
Make sure your server responds quickly when the client requests the HTML. In the HTML, directly reference the LCP image to ensure there is no delay between loading the HTML and discovering the image.
4. Preload and prioritize the LCP image
When the browser loads your website, the HTML code will reference a large number of additional resources (e.g., stylesheets, scripts, images). The browser needs to assign a priority to each of these requests.
Images are generally considered low priority, as they don’t block other content from appearing on the website. However, the main image that’s responsible for the LCP should be loaded early.
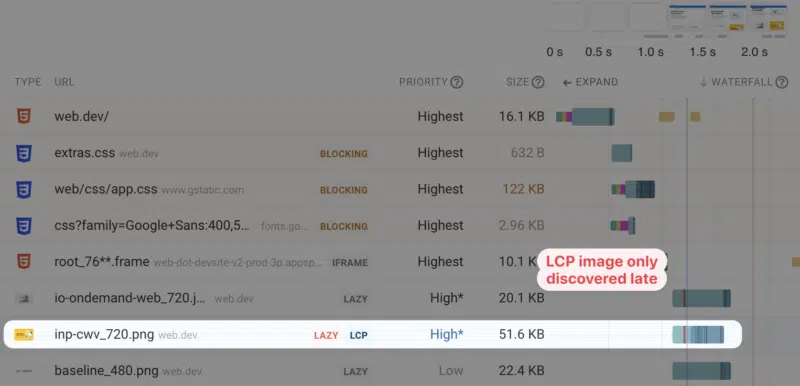
A request waterfall visualization can surface these issues. In this example, we see that the LCP image only starts loading late and initially has a low priority. Then, when the browser realizes that the image is in the viewport, the priority changes to high.
The LCP score can be optimized with the fetchpriority attribute. This HTML attribute tells the browser if a given resource is important, and can simply be added to an img tag like this:
<img src="photo.jpg" fetchpriority="high">With this attribute in place, browsers can start loading the image as soon as possible and prioritize downloading it over other resources on the page.
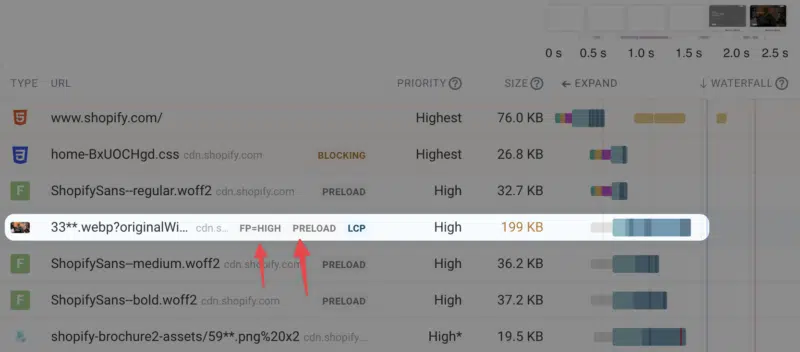
If the image isn’t referenced directly at the top of the HTML document, a preload resource hint can also be used to start loading the image early.
That way, when the image is added to the page, the image shows up right away rather than only starting to load then.
5. Monitor page speed continuously
Running one-off tests on your website is a great way to start optimizing your performance.
But are those optimizations actually working for real users?
And what happens if there’s an unrelated change that makes performance worse?
In that case you need a website monitoring tool like DebugBear.
A performance monitoring tool continuously tests your website and your competitors’ websites. You’ll get:
- Detailed reports with suggestions to improve your page speed.
- Alerted if your website performance gets worse.
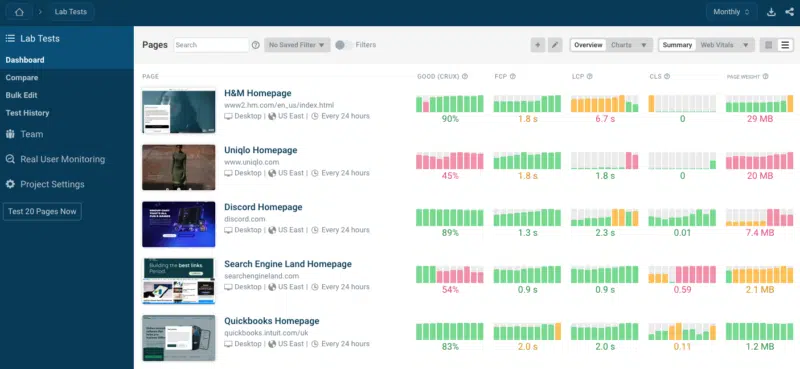
DebugBear includes three types of data:
- Scheduled lab-based tests.
- Google CrUX data (which impacts SEO).
- Real user monitoring.
Having this insight into your website provides the foundation your team needs to pass Google’s Core Web Vitals assessment.
Related stories
