Data Visualization & Infographic Search Engine Visual.ly Launches
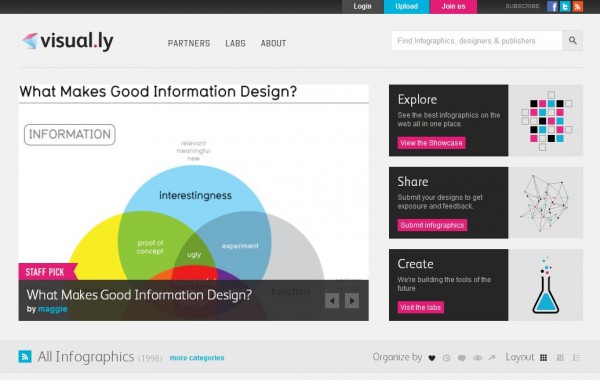
Infographics (or data visualizations) are all the rage in content marketing today, and Visual.ly is launching with hopes of becoming “the largest community for sharing, creating and promoting data visualizations.” The site currently offers a search functionality and a submission feature to help users find & share infographics from across the web. [youtube]https://www.youtube.com/watch?v=AiVKfNeRbPQ[/youtube] As expected with […]

Infographics (or data visualizations) are all the rage in content marketing today, and Visual.ly is launching with hopes of becoming “the largest community for sharing, creating and promoting data visualizations.” The site currently offers a search functionality and a submission feature to help users find & share infographics from across the web.
[youtube]https://www.youtube.com/watch?v=AiVKfNeRbPQ[/youtube]
As expected with a name like Visual.ly, the site is aesthetically appealing with quite a few bells and whistles. A “Twitterize Yourself” section exists allowing users to face-off against other users while cartooning themselves. The ‘labs‘ section of the site is currently in beta and will be a source to help users facilitate the creation of graphics. However, the main resources to Visual.ly are the search and sharing aspects, so let’s take a look at how these work.
Searching
Properly indexing data rich images is a tough task to undertake. Visual.ly is achieving this by leveraging a few different variables – description, tags, titles and sources (both designers & publishers). A sample search for iPhone currently displays 15 results on Visual.ly:
To compare these results, a search on Cool Infographics, an Infographic repository, provided slightly less results with only 11 items tagged with iPhone.
Descriptions play heavily into the search results and are very reliant on the information supplied by submitters. For example, a business related infographic ranks for the query “dog” due to the fact that the description contains the phrase, “to the top dog CEO of a major corporation.” Niche search results leave room for improvement as well. On a query for “Chicago” Visual.ly returns tw0 non-Chicago related results, one about the national debt and the other about Whales. On the other hand, a site search on Cool Infographics returns an infographic about the Chicago Tribune, and an image about population shifts in major cities (that includes Chicago). A quick Google search shows quite a few more Chicago infographics that are not in Visual.ly’s results.
One item that may be a concern is users can upload infographics and potentially insert non-relevant keywords to help their graphics be found. For example, a search for “Macs” is currently returning some results for design agencies and other non-Mac related results. Mislabeling for personal gain could be a problem as there have been previous issues around non-relevant labels for the purpose of link building.
Sharing
In order to have an infographic included in the Visual.ly database, users can share their designs. Not only can designers gain exposure, but can get feedback similar to Dribbble. Members can ‘like’ infographics and provide feedback using Facebook’s comment plug-in.
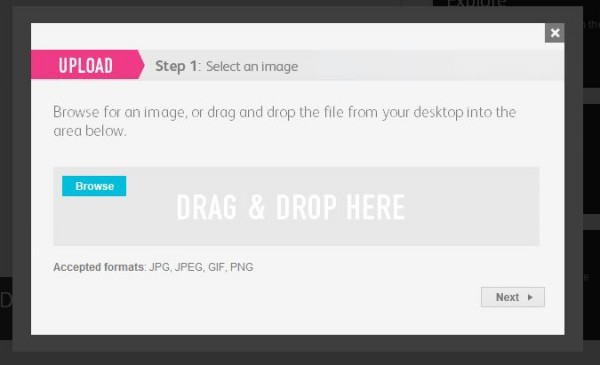
To submit an infographic, users have to upload an image, create a thumbnail, then add a title, tags and a description. They are then taken to a screen where users add the publisher, website published to, the original designer and the designer’s website. All of this information is included with links on the infographic’s page.
Content Ownership
One interesting feature of Visual.ly is the ability to claim credit for creating an infographic. Visual.ly features “published by” and “designed by” variables that show where the infographic resides and the designer/company that created the graphic. For example, this education related infographic shows that the image was published by The Daily and designed by Hyperakt. To claim publish or design credit for a graphic, the user must fill out a form with a link to their website that confirms your credit for the graphic:
One item that did seem strange is that if the embed code from the site is used, all of the links are sent back to visual.ly instead of to the original publisher or designer. Having the publisher and designer link show in the embed code would be a nice touch to help with the attribution of the graphic.
Conclusion
Overall, Visual.ly’s search feature works for broad terms, but is lacking on detailed queries and looks to be open gaming of the results with some simple keyword insertion into descriptions and tags. While the functionality of adding in publishers and designers is nice, it did seem that more credit could be given, especially with the embed codes. The idea behind Visual.ly is quite unique and with some simple refinements could become a great resource for those looking for data visualization inspiration and for publishers/designers looking to get more exposure for their work.
Contributing authors are invited to create content for Search Engine Land and are chosen for their expertise and contribution to the search community. Our contributors work under the oversight of the editorial staff and contributions are checked for quality and relevance to our readers. The opinions they express are their own.
Related stories
New on Search Engine Land


