Can Search Queries And Social Data Predict The Presidential Election Outcome?
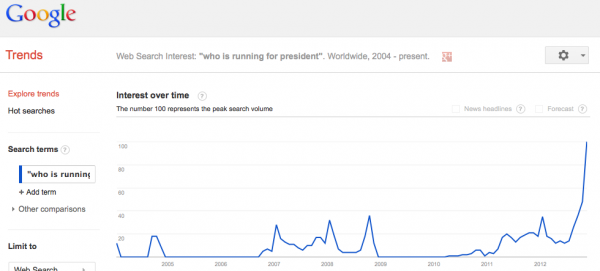
By the time this election is over more than $2.6 billion will have been spent by the two US presidential candidates on political advertising. I’ve also seen some estimates that say total political advertising this election cycle will top $6 billion. Yet, remarkably, The Atlantic points to a Google Trends report showing a huge November […]
“Who’s Running for President?”
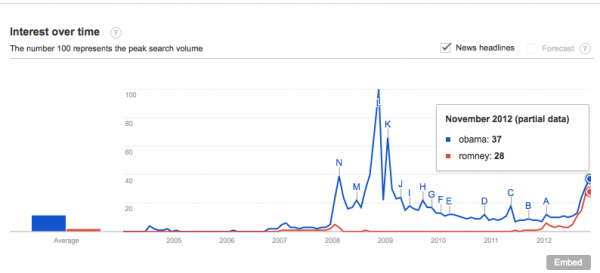
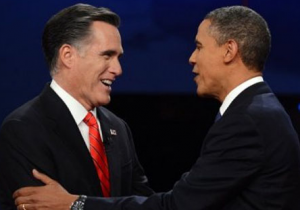
If you compare “Obama” to “Romney,” Google Trends reflects that Obama comes out just ahead of Romney, the same way many believe this election will turn out later this evening.
Obama Wins Online Presence & Social Media Battle
Rather than a squeaker, Wordstream CTO Larry Kim sees an Obama landslide instead. He bases this prediction on a comparison of the candidates’ online campaigns. Kim looked at a range of variables from both of the campaigns’ online advertising and social media efforts.
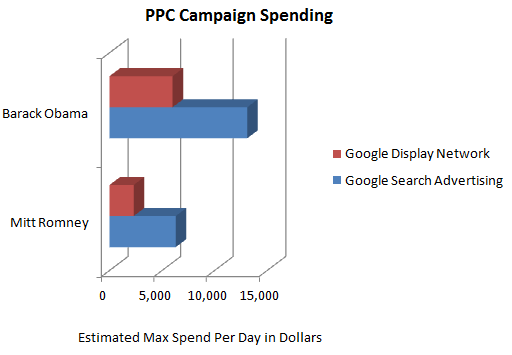
Kim calculated that Obama outspent Romney in both paid search and online display advertising.
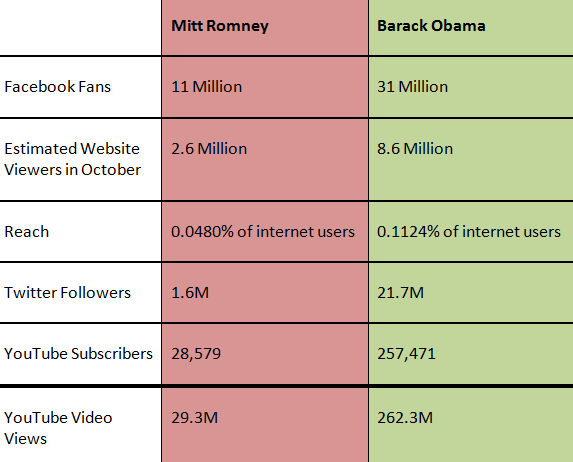
Kim also found Obama had a more extensive social media presence, greater reach and more engaged fans vs. the Republican challenger.
The Wordstream chart below reflects that Obama has roughly 3X Facebook fans, and more than 20X Twitter followers than Romney.
According to Kim these numbers argue strongly that Obama will win (and win big) this evening. We’ll know relatively soon whether Kim (and Nate Silver) were right or wrong.
Red vs. Blue: Local Search Edition
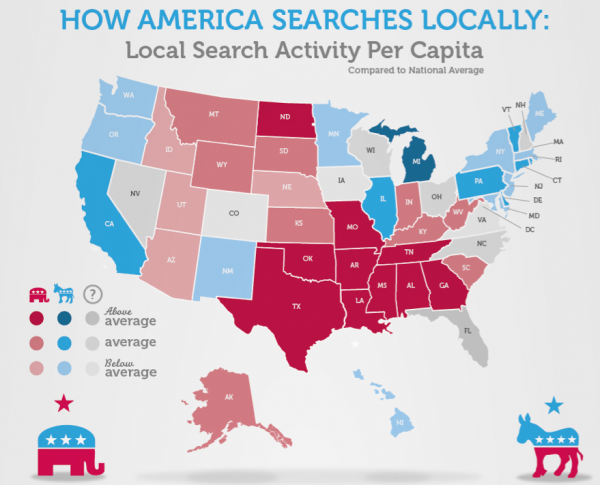
Finally the good folks at YP have compared local and mobile search behavior in red states and blue states and found the following:
- Per capita local search: Red states and swing states search roughly the same amount but 45 percent more than blue states
- Local-mobile search: Red and blue states search nearly the same amount but 25 percent more than swing states
- Blue state residents search roughly 17 percent more for employment related categories than red state residents (this is ironic given that those out of work are supposed to be supporting Romney)
- Red state denizens perform 20 percent more government and government services related searches than blue staters (also ironic or unexpected because red staters are supposed to despise government)
Finally back to those confused souls searching on “Who’s running for president?” If those queries aren’t coming from someplace far outside the US I’d really hate to be (or meet) one of those people.
The data reminded me of the very funny SNL skit from several weeks ago satirizing “The Undecided Voter.”
If you haven’t voted yet, you’ve still got a little time. Get out and vote.
Related Entries
Contributing authors are invited to create content for Search Engine Land and are chosen for their expertise and contribution to the search community. Our contributors work under the oversight of the editorial staff and contributions are checked for quality and relevance to our readers. The opinions they express are their own.
Related stories
New on Search Engine Land
