Using Component Metrics In Your SEO Analysis
Metrics are necessary, but looking at them in isolation can be misleading. Columnist Chris Liversidge shows how combining metrics can give you better context.

There are a lot of great SEO performance ranking tools out there, many with unique features that add real value for a search marketer attempting to report clearly on performance improvements.
But can SEO learn from PPC and start isolating performance components better to allow for real analysis?
I think so — which is why I’ve been trialing a few “component metrics” to create better context in SEO reporting.
Understanding Components
Component metrics, as my data scientist friends like to say, isolate only one aspect of performance, and they are most valuable shown alongside other component metrics to create context.
Let me give an example using two component metrics with which digital advertisers should be familiar: CPC and CPA.
CPC (“Cost Per Click,” for casual readers) is a useful component metric, as it gives an unambiguous clarity on the price being paid each time a user clicks your ad. It’s simple, it’s easy to understand, and it’s probably one of the most important metrics in a PPC campaign.
But you couldn’t run a campaign efficiently just using CPC alone. Let’s walk through the gaps that scenario would create.
You are three months into a new PPC campaign. Although you started with a small budget (say, $1,000 a week), you’ve been ramping up spend each week as you’ve managed to consistently bring down your CPC over time.
You don’t have another metric to look at, but as an experienced search marketer, you know it’s probably driven by expanding your campaign ad groups to only use tightly themed creative matched to the terms triggering your ads.
Your click-through rate is probably pretty good, and over time you’ve built a click history which is probably improving your Quality Score. All is right with the world.
Your boss walks into the room, takes you to one side and tells you he appreciates your hard work, suggests you have a bright future, and, gently but firmly, fires you.
“But I don’t understand!” you protest while being escorted off the premises, a box in your hands containing a photo of your wife, a novelty poster the guys gave you on your birthday, and a Google pen left by a rep. “My campaign had the lowest CPC I’ve ever achieved!”
“Yes, Frank,” says your (now former) boss, “but not a single PPC sale was made.”
If only poor old Frank had taken the time to add CPA (Cost Per Acquisition) to his reporting, perhaps he would still be making notes on his novelty calendar using his favorite pen today.
Graphing component metrics — such as CPC and CPA — together is a great way to get clear understanding on a “combination metric.” Here, for example, we use CPC and CPA to get a feel for the efficient growth of our campaign over time. Looks like we’ve got some work to do on this campaign!

Viewing CPC alongside CPA allows you to understand at a glance if you’re driving profitability efficiently. In this case, not so much!
Similarly, looking solely at ROI (Return on Investment) would not give context of the source of revenue growth or efficiency. Graphing revenue and PPC spend is, of course, a simple way to get a window on that — but better in that scenario would be looping in a few other component metrics: PPC Revenue, Non-Brand (or Shopping) Traffic and CPC, for example.
All of these metrics together give a very solid context to campaign performance, areas of efficiency and scope for improvement.
Component Metrics In SEO
So, what about SEO? What component metrics do we use typically? Rank, Traffic (ideally split brand vs. non), Impressions vs. Clicks (i.e., SERP [Search Engine Results Page] click-through rate), Organic Bounce Rate, Organic Conversion Rate, Total Links, Links by Domain, Indexed Pages, Page Response Time (segmented desktop, tablet, mobile). Perhaps a few others, but that’s the core.
All of these are useful for general campaign performance and traffic behavior analysis, but none are suitable for drilling into ranking performance in any detail.
We might use a proprietary metric from our preferred ranking tool for that. At QueryClick, we use our in-house tool, SearchLens, which uses “Search Visibility” — a metric which takes into account a few factors:
- The average CTR (click-through rate) for a given SERP ranking (so ranking position #1 is factored by the position #1 CTR avg [c22.96 percent], and #11 by the position #11 CTR [c1.37 percent], and so on).
- The number of competing results for the key phrase term (so ranking for a term with 10 million results generates a much higher score than one with only 1,000 results).
- The market share of the search engine in the country you’re gathering results in (so ranking #1 in Google in the UK is worth significantly more than a #1 in Bing).
In short, it attempts to show the strength of the ranking in purely SEO terms.
Recently, we have experimented with viewing two other component metrics alongside: a value and a general change metric.
So what kind of visibility on rank performance do we get now? Let’s look at a graph with just strength and value to get a feel.
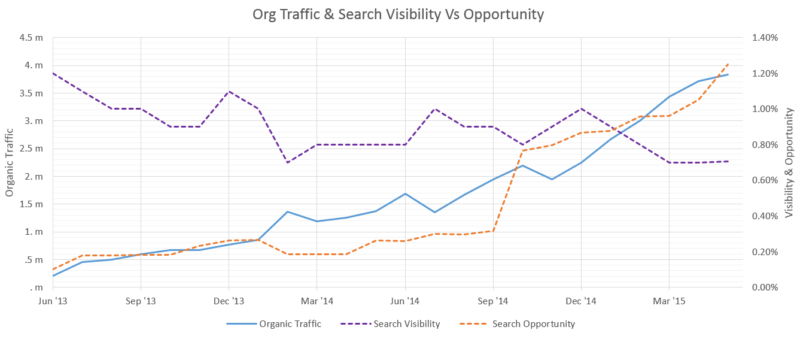
In the above image, we see that despite a loss of “Search Visibility” across the key phrase set measured, rankings against our “Search Opportunity” measure have improved significantly, driving organic traffic as a result.
This occurs when losing rank for a few highly competitive, but less relevant one- or two-word key phrases, but many more terms gain ranking that are are highly relevant and trafficked for PPC reach top three positions in high market share countries (driving up captured “Opportunity”). This helps put focus on achieving relevant, targeted performance, rather than vanity ranking for overly generic terms.
Compared to a simple rank grouping and the change of a single SERP “visibility” metric over time, the three component metrics give a strong picture of what’s changing and what can be improved.
Our first metric is our “Search Visibility” score, giving an idea of the overall strength of our rank group. If we gain movement for terms with lots of results listed, then this will reflect that.
Equally, if we lose rankings on high competition terms, then we’ll see a big dip here. In essence, this is a bellwether for performance on short key phrase terms with lots of targeted content out there — “shoes” or “menswear,” for example.
Strong performance here indicates you are able to rank top three for the most difficult terms in your market. If you have the best score in this metric, you are the strongest SEO competitor in the set.
Our second metric is “Search Opportunity.” This again uses the average CTR for your ranking, but instead of taking competing results, it brings in the number of searches for the term via AdWords. This gives an understanding of the traffic impact of a change, and your ranking ability to capture the most commercialized, targeted search terms in the set (i.e., the most valuable). I expect these terms to be 2–3 words long (“leather brogues,” “short-sleeve polo white” and so on).
Strong performance here shows you are targeted to the most commercially valuable terms, and this metric shows if you are seasonally matched to your target audience’s searching habits.
A final metric I would consider including is a weighted rank average score taking into account the CTR only (I use “Search Change” for this metric). This is an important component metric, because the other two metrics use rank CTR and so will be affected if we gain or lose rankings in high CTR areas (position 1 to 3 in particular, as the CTR rate is an exponential drop away from position 1).
Strong performance here means we are increasing our ranking position to the top positions over time, and particularly in the highest rank positions. This is agnostic to the competition or traffic associated for a term, so a 5- to 6-word key phrase will impact this just as much as a one-word term. Thoughtful key phrase selection is therefore important to make this metric relevant.
In addition, I like to show the grouped key phrase volumes in categories with these components, to get an idea of where the rank changes are coming from. Start segmenting your key phrase terms, and you have a suite of reports giving your biggest gaps in ability to perform versus captured, relevant traffic, and if you are improving or dropping away over time.
So what component metrics do you use and find most useful in your search marketing role?
Contributing authors are invited to create content for Search Engine Land and are chosen for their expertise and contribution to the search community. Our contributors work under the oversight of the editorial staff and contributions are checked for quality and relevance to our readers. The opinions they express are their own.
Related stories
New on Search Engine Land
About the author