Measuring PPC Account Efficiency Vs. Volume: A Case Study
In making your PPC accounts efficient, are you passing up volume that could be profitable? Columnist Matt Umbro checked it out in one account.

As PPC professionals, we are constantly working to optimize accounts. Whether it be improving conversion rate, increasing ROI, or lowering cost per conversion, the job is never done. We want to show our clients the best results and have them feel justified in hiring us.
Another phrase I use in conjunction with the term “optimization” is “account efficiency.”
In other words, are goals consistently being met, or does performance vary month to month? If the former, then chances are the account is efficient, meaning relevancy from search query to conversion is well aligned.
However, therein lies an issue that is constantly on my mind….
Efficiency Vs. Volume
In making accounts efficient, I tend to worry that I’m leaving conversions on the table. I struggle with the notion that I’m making my keywords too specific or that I’m limiting ad exposure in other ways.
And I’m not talking about bidding on a root term in a broader match type in order to secure a few more conversions — I’m concerned that overall account decisions are limiting additional qualified traffic.
To try and quantify this notion of efficiency vs. volume, I’ll be presenting data from an e-commerce account that my agency inherited at the beginning of July. The data will look at Google AdWords year-over-year performance for July, August and September.
The reason I am reviewing this particular account is because we essentially started from scratch. The account had been dormant for a couple of months and, along with a new strategy, needed extensive campaign builds.
I want to emphasize that this case study and my associated thoughts should not be considered universal. As with everything PPC, there are so many variables. What works for one account may not work for another. This study is an attempt to quantitatively review the data and provide my analysis. You might do the same for your accounts to measure their efficiency.
The Case Study
Before presenting the data, I want to share exactly how I went about making the account efficient so as to provide context around the numbers. First off, all new campaigns included these parameters:
- Ad groups consisted only of exact and modified broad match keywords
- Each campaign began with a negative keyword list of 80 terms; these negatives came from historical account performance and proactive research
- All ad groups contained at least four ads — two targeting desktops and two showing on mobile devices
- Along with Search Network text ads, Google Shopping, Remarketing, Dynamic Search Ad (DSA), and Remarketing for Dynamic Search Ad (RDSA), campaigns began running in the first week of account management
- Sitelinks were used in every campaign; additionally, we were able to participate in the callout extensions beta and started running in early August
Next, bids were aimed at showing ads within the top three positions. Average position for Search Network text ads (not including Brand) during this time period was 2.2.
Finally, there were general Display campaigns (non-remarketing) running in 2013 that aren’t present in 2014. These Display campaigns accounted for less than 10% of overall spend; however, they encompassed about 1/3 of total impressions.
Traffic Metrics
First, let’s take a look at click-through rate (CTR) and average cost-per-click (CPC) for just the Search Network (as the Display campaigns of 2013 would severely skew data).

CTR: 2013 vs. 2014
CTR remains stagnant in July year-over-year, but the big jumps come month-over-month.
From July 2014 to August 2014, CTR rises by 0.19 percentage points. During that same time period in 2013, CTR decreases by 0.01 percentage point. Even though September 2014 CTR decreased by 0.05 percentage points, it still saw a nice jump year-over-year.
CPCs also trended in the right direction, as 2014 monthly figures were lower than their 2013 counterparts. In both years, CPCs increased from month to month, representing a seasonal trend (which is accurate to the demand of this product).
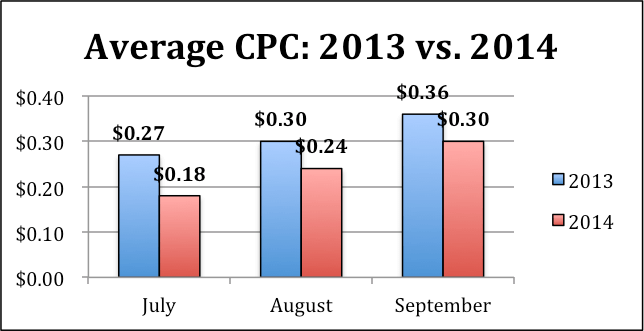
Average CPC: 2013 vs. 2014
Conversion Metrics
Similar to CPC, conversions spiked from July to August during both years. However, conversions nearly doubled in 2014 — whereas in 2013, they only increased by about 17%.
Both September months saw conversion growth from the previous month, as well. September 2014 saw 152 more conversions than August, while, in 2013, August to September conversions increased by 29.
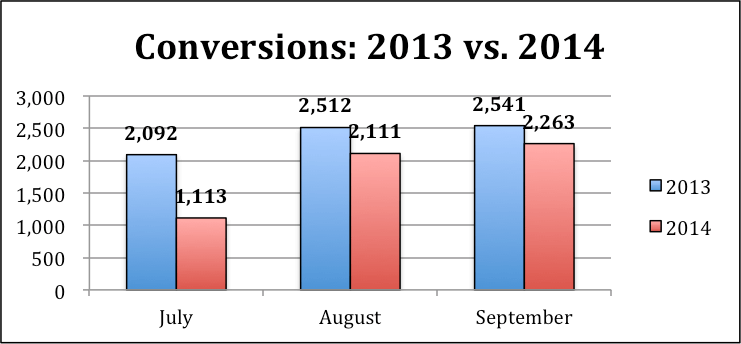
Conversions: 2013 vs. 2014
It’s interesting to note the cost difference in relation to the conversion graph. Both years see increased costs month-over-month with 2014 seeing more dramatic changes.
When we compare this graph with conversions, we see that August 2014 saw 84% the conversions of August 2013 at only 63% of the cost. Based upon all graphs so far, the month of August is when the account had its most efficient month.
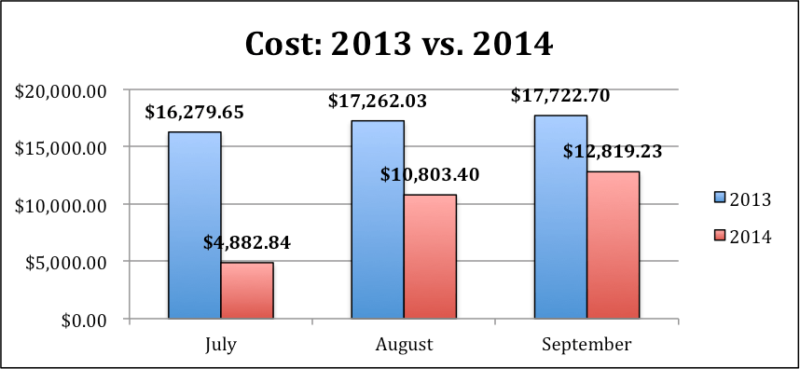
Cost: 2013 vs. 2014
Furthermore, cost-per-conversion in August and September 2014 were at least $1.31 less than their 2013 counterparts. Not only was overall cost and cost-per-conversion lower in 2014, but also, conversions nearly hit 2013 figures.

Cost per Conversion: 2013 vs. 2014
Revenue Metrics
Following the conversion trend, each month’s revenue in 2014 was a greater percentage of that same month in 2013.
September 2014 revenue was just under 82% of September 2013 revenue at roughly 72% the cost of the previous year.
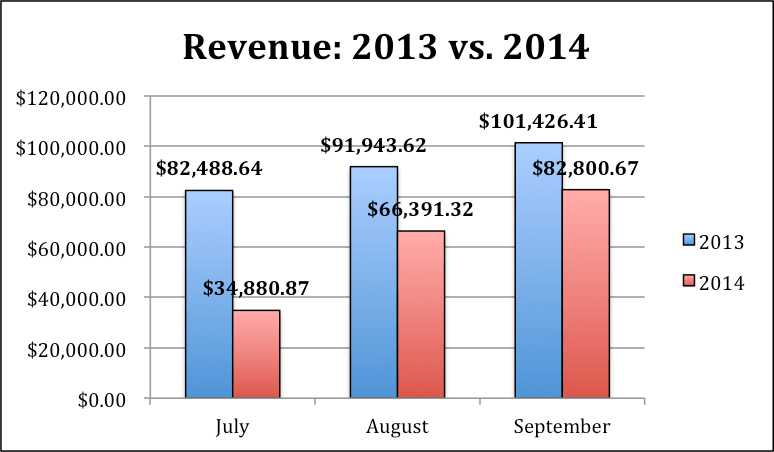
Revenue: 2013 vs. 2014
Finally, when reviewing return on ad spend (ROAS), each month in 2014 is above 500%.
Here is where efficiency comes most into play as the account is spending less and showing a better return. Overall, conversion and revenue volume are lower, but show solid increases month-over-month.

ROAS: 2013 vs. 2014
Going Back To The Central Concern
I hope, after presenting this case study, my concern about account efficiency vs. volume is clearer. Based upon all data, account efficiency is much improved over 2013 as ROAS is up, cost-per-conversion down, and CTR increased.
The caveat is that overall conversions are down. The question that must be asked is whether we should be OK with these results. Does better efficiency make up for volume loss?
In this case, I would say yes. Lost in this discussion is that the account has been growing month-to-month, even if volume is lower than last year.
It’s not like maximum efficiency has been hit and everything else is secondary. New campaigns are actively going live while optimizations are constantly being made. Throw in the seasonality factor, and a strong effort is being made to garner more qualified traffic.
Ultimately, the goal of many PPC accounts is to become more efficient. Gaining the most conversion and revenue volume is the main goal in some accounts, but by-and-large, showing high efficiency is necessary.
I would add that there needs to be more of a balance, but more so stacked in the favor of efficiency. In other words, gaining more high quality traffic should complement account efficiency.
Contributing authors are invited to create content for Search Engine Land and are chosen for their expertise and contribution to the search community. Our contributors work under the oversight of the editorial staff and contributions are checked for quality and relevance to our readers. The opinions they express are their own.
Related stories
New on Search Engine Land
About the author