The Right Time To Start Analyzing Data
You’re a product person. You’ve bootstrapped together your website, dropped relevant metadata, setup an e-commerce platform, installed analytics, and are generating solid original content on your site and/or blog. You’re doing everything by the book. But the question remains: when it is the right time to dig in and try to understand what people are […]
You’re a product person. You’ve bootstrapped together your website, dropped relevant metadata, setup an e-commerce platform, installed analytics, and are generating solid original content on your site and/or blog. You’re doing everything by the book.
But the question remains: when it is the right time to dig in and try to understand what people are doing once they get to your site?
In the early stages of a website, analytics are a double-edged sword. Dig in too early and you don’t have enough data, wait too long and you potentially lose out on opportunities for growth and revenue. As a result, I believe it’s never too soon to look at the data but you need to respect statistical significance or else you’ll be making emotional rather than data driven decisions.
The right time to dig into traffic patterns is when you have statistically significant insights from visitor behavior. With significant data, you can differentiate between the noise (unexplained variation within a data set) and the true variation.
There are a number of tools available to help calculate statistical significance, usually based in excel. I’m a fan of Rags Srinivasan’s calculator because it’s simple and to the point. (Note the link is a downloadable ZIP file from Avinash Kaushik’s site.)
It’s worth noting that the calculator has two tabs – a T test and Chi Squared test. Chi-Squared tests are more stringent than T tests and as a result I prefer to use the Chi-Squared test. The math behind these tests is pretty heavy. If you’re interested in fully understanding the methods of calculation, start here.
The logic behind statistical significance stems from standard deviation. The standard deviation represents how much variance exists within a data set. To calculate the standard deviation (σ) we consider the average variance between a random point in the data set and the mean.
To make sense out of this, consider a normally distributed bell curve:

By definition of normal distribution, 95% of the data exists within two standard deviations of the mean. If we test a data point for significance and it falls outside of this 95% interval then we can confidently say it’s statistically significant. If the test generates a data point within the 95% confidence interval then we consider it to be statistically insignificant.
Check out this post by Avinash Kaushik if you want to read more about the calculation process of statistical significance.
Getting back to analyzing website traffic, we can leverage statistical significance formulas to determine the right time to begin making decisions based on visitor data. I refer to this point the action threshold – the number of actions that make a particular traffic source viable and significant.
It’s worth noting that this is an unconventional application of a significance test – a traditional use case is to compare two data sets for correlation – in this case I’m not asking how similar two data sets are, I’m asking at what point is a data set significantly different than a null case.
Consider a very simple example where we have 100 visitors and our goal is to get visitors to sign up for a free trial. In the calculator, set the control to 100 visits and 0 sign ups. Then in the test, set visits to 100 and sign ups to 1:
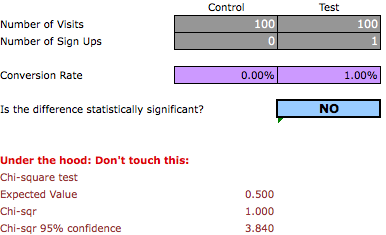
The result is not significant because the Chi-Squared value is below the 95% confidence value. Keep increasing the number of sign ups until the Chi-Squared value is larger than the 95% confidence value and the test will deem the results significant:

In this example, 4 sign ups represents the action threshold. This means that making decisions on less than 4 actions is premature. We run this test to prevent ourselves from making rash decisions caused by impatience and gut reactions. I suggest you run a similar test to determine your action threshold then sit back and collect traffic, wait until there are enough actions to deem the results statistically significant before hunkering down to dig through the data.
Contributing authors are invited to create content for Search Engine Land and are chosen for their expertise and contribution to the search community. Our contributors work under the oversight of the editorial staff and contributions are checked for quality and relevance to our readers. The opinions they express are their own.
Related stories
New on Search Engine Land
About the author