3 pitfalls of PPC experiments
Knowing what to test and how to interpret the results based on nuances and oddities of experiments is an important skill for people, not automations.
While there are many true-and-tried best practices in search marketing, the devil is in the details when it comes to achieving the best results. For example, it’s hard to argue with the merits of automated bidding but it’s not that hard to get bad results if you deploy it incorrectly.
Say you read that Hertz used smart bidding to reduce their CPA by 35% so you decide to deploy the same strategy in your account. If it were that simple to run a successful Google Ads account, we’d all be out of jobs. Simply knowing what feature to use isn’t enough as you also need to know the right settings that will make it work as well for you as it did for the advertiser in the case study.
And to be the best search marketers we can be, we can’t simply look at what other advertisers did. Instead, we can take hints from others and use it as the basis for honing in on what works for us. We have to discover the details of the right way ourselves.
And that’s why being really good at PPC experimentation is so important. I spoke on this topic at SMX East in the session “Awesome Tests, Profitable Results,” and here are some of the key takeaways.
The three most popular PPC testing methodologies
One of the key claims to fame of search marketing is that it’s more measurable. So whenever we try something new, we better have some numbers to back up our findings so we need to run experiments in a structured manner.
There are three ways we usually see this done.

Before-and-after tests
The simplest way to start a test is to make a change in a live campaign and then compare the results from before and after the change was implemented. The beauty of this method is that you can test anything in your ads account quickly. The downside is that while setup is super quick, measurement takes more effort and you can’t have an apples-to-apples comparison because results may be impacted by external factors that change during the before- and after periods.
How much data to compare
When measuring results, allow enough time to minimize time-based factors. And while I’d love to tell you exactly how much time that is, remember the point that things differ for every advertiser, industry, etc.
But if you want some guidance, at the very least measure one full week before and after to remove the impact of weekday versus weekend performance.
If you are in a vertical where not just the day of the week but also the time of the month plays a role, e.g., in automotive, measure a full month before and after the change. In automotive, the time of the month may impact how aggressive dealers are on price as they try to hit monthly targets and consumers’ willingness to buy fluctuates along with the dates when they get their paychecks.
Lookback windows for bid management changes
Specific to bid management, if you’re using the before-and-after technique to measure impact, remember that your lookback window should be the same as the frequency of your changes. For example, if you make bid changes every day, you can’t look at the last 30 days of performance data because that might include data from 30 different bid levels, one for each day of the lookback period.
Ads experiments
So clearly, a before-and-after testing methodology comes with some serious challenges and that’s why both Microsoft and Google have added features to run better tests in PPC accounts. While it takes a bit more time to set up the experimental campaign with all the changes to be tested, it has the benefit of removing any potential skew in results that’s common in before-and-after tests. It does this by letting the advertiser do a split test, for example, a 50-50 split where half the users are served the control and the other half the experiment.
And not only are the results more reliable, whatever time is invested to set up the experiment is easily recouped because reporting of results is baked into the product.

Market split tests
Larger advertisers, or those trying to measure the impact of offline changes on online performance, may consider doing a split test where the split isn’t based on individual users (or cookies) but rather the split is between entire geographic areas. For example, an advertiser could run TV ads in San Francisco and not in Seattle and use Seattle as the control and SF as the experiment. This is much more complicated so I won’t go into it here.
Why a control may be impacted by the experiment
As much as we may try, there is no way to run an experiment and know with absolute certainty that the result is due to what we did and not due to another factor beyond our immediate control. Even when doing a split test where we assume to have a solid control, its results may be impacted by second-order effects.
The experience of one of our clients illustrates this really well. They ran an experiment to test if Target CPA (tCPA) bidding would improve the performance compared to bidding manually with the help of scripts and rules. To their surprise, the average CPC in the control quickly went way up. What happened?
Smart bidding started testing more aggressive bids and astute competitors with timely alerts noticed this and increased their own bids. These higher bids started to impact the control where average CPCs went up and impression share was lost when the bids couldn’t keep up with the competition. So the lousy results in the control were attributable to the changes the experiment set in motion. Talk about making it hard to really understand what’s going on!
The point is that PPC is a dynamic space and any change that’s made can have far-reaching effects. Looking with too narrow a lens can make us miss the real reason why something changed.
Why the experiment may not be the real reason for the change
In another example, we found an advertiser testing tCPA smart bidding but not seeing the results they were hoping for. After investigating, it became clear that the problem wasn’t with bidding, but with conversion tracking.
When the advertiser was bidding manually, they were using their human common sense to keep bids high for relevant upper-funnel keywords even though they weren’t seeing many direct conversions from these.
But when they switched to automated bidding, it started reducing bids for these ‘non-converting’ keywords because it had no way to understand their importance at the earlier stages of the consumer journey.

The point is that you can’t always test things in isolation. Before you test smart bidding, you should have your measurement set up correctly.
Why the experiment results obscure opportunities
Once you discover a winning experiment, you may think you’re done, but there’s always more to optimize. Remember that Google and Microsoft just report on whether the control or the experiment won. But if the experiment wins, it doesn’t mean that everything about it is better than the control. It means that in aggregate, the combination of things in the experiment is better than the combination of things in the control.
Going deeper to identify these combinations can take a lot of time and that’s why winning PPC specialists should consider having a few tricks up their sleeve to go beyond what the average advertiser will pay attention to.
Most advertisers will just launch the winner and move on to another experiment. PPC rockstars, on the other hand, will use techniques to look deeper to understand why the winner won and to find further opportunities to improve performance.
Responsive Search Ads provide a good example. In aggregate it’s easy to see if RSAs are good or bad for an ad group by looking at the typical KPIs like conversions, CPA, and ROAS (or better yet, profits). But what the ad group-level aggregate hides is what’s happening at the query level and in search, the query is everything.
I’ve written scripts and written about how to do a deeper analysis of RSAs and it can lead to some really interesting findings.
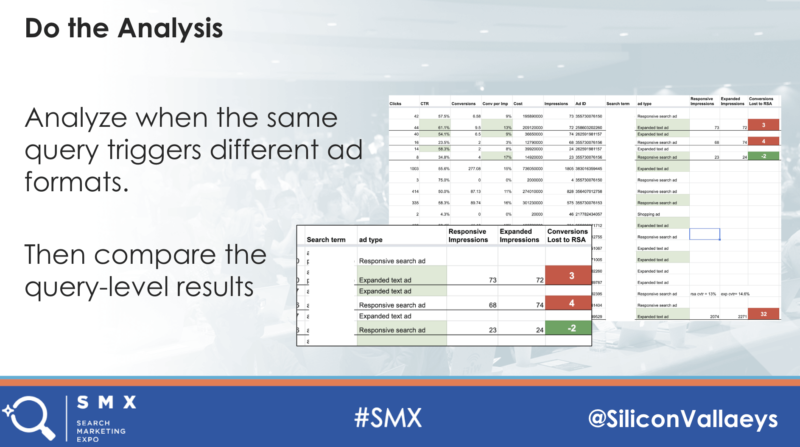
By combining a query report with an ad report, it’s possible to see when a query triggers only an ETA, only an RSA, or both. Then it can be measured how many conversions are lost by showing multiple ads and then the query can be split out with only the best performing ad type.
When we did this analysis for a client, we found one instance where they kept the wrong ad for a brand query. By fixing this single mistake, the branded query started delivering significantly more conversions for the same number of impressions.
Conclusion
I’ve written at length on the future of humans in a world where PPC is becoming more automated. Being really good at experimentation is one of the aspects where we can differentiate ourselves. And while tools make testing faster and more measurable, knowing what to test and how to interpret the results based on the many possible nuances and oddities of experiments is a very human skill and one we should all understand as much as possible.
Contributing authors are invited to create content for Search Engine Land and are chosen for their expertise and contribution to the search community. Our contributors work under the oversight of the editorial staff and contributions are checked for quality and relevance to our readers. Search Engine Land is owned by Semrush. Contributor was not asked to make any direct or indirect mentions of Semrush. The opinions they express are their own.
