57 insightful Facebook statistics for marketers in 2025
If you’ve ever questioned whether Facebook is a good marketing platform for you, this list of key Facebook statistics should provide the clarity you need.
Let’s dive in.
Facebook statistics highlights
Here are five of the most impactful Facebook marketing statistics we found:
- Nearly one quarter (23%) of marketers say that Facebook has the best return on investment (ROI) of all social platforms (HubSpot, 2024)
- Facebook is the most popular social media platform worldwide (Statista, 2024)
- Ad sets with three to 10 creatives outperform ad sets with only one and lower the median cost per action by 46% (Meta, 2023)
- Of U.S. adults who use Facebook, 68% say they earn more than $100,000/year (Pew Research, 2024)
- Over 70% of marketers report Facebook as an effective platform for video marketing (Wyzowl, 2024)
General Facebook statistics
- Meta (Facebook’s parent company) had an annual revenue of $134.9 billion in 2023 (Meta, 2023)
- Of social media users outside of China, 20% say Facebook is their favorite social media platform (GWI, 2023)
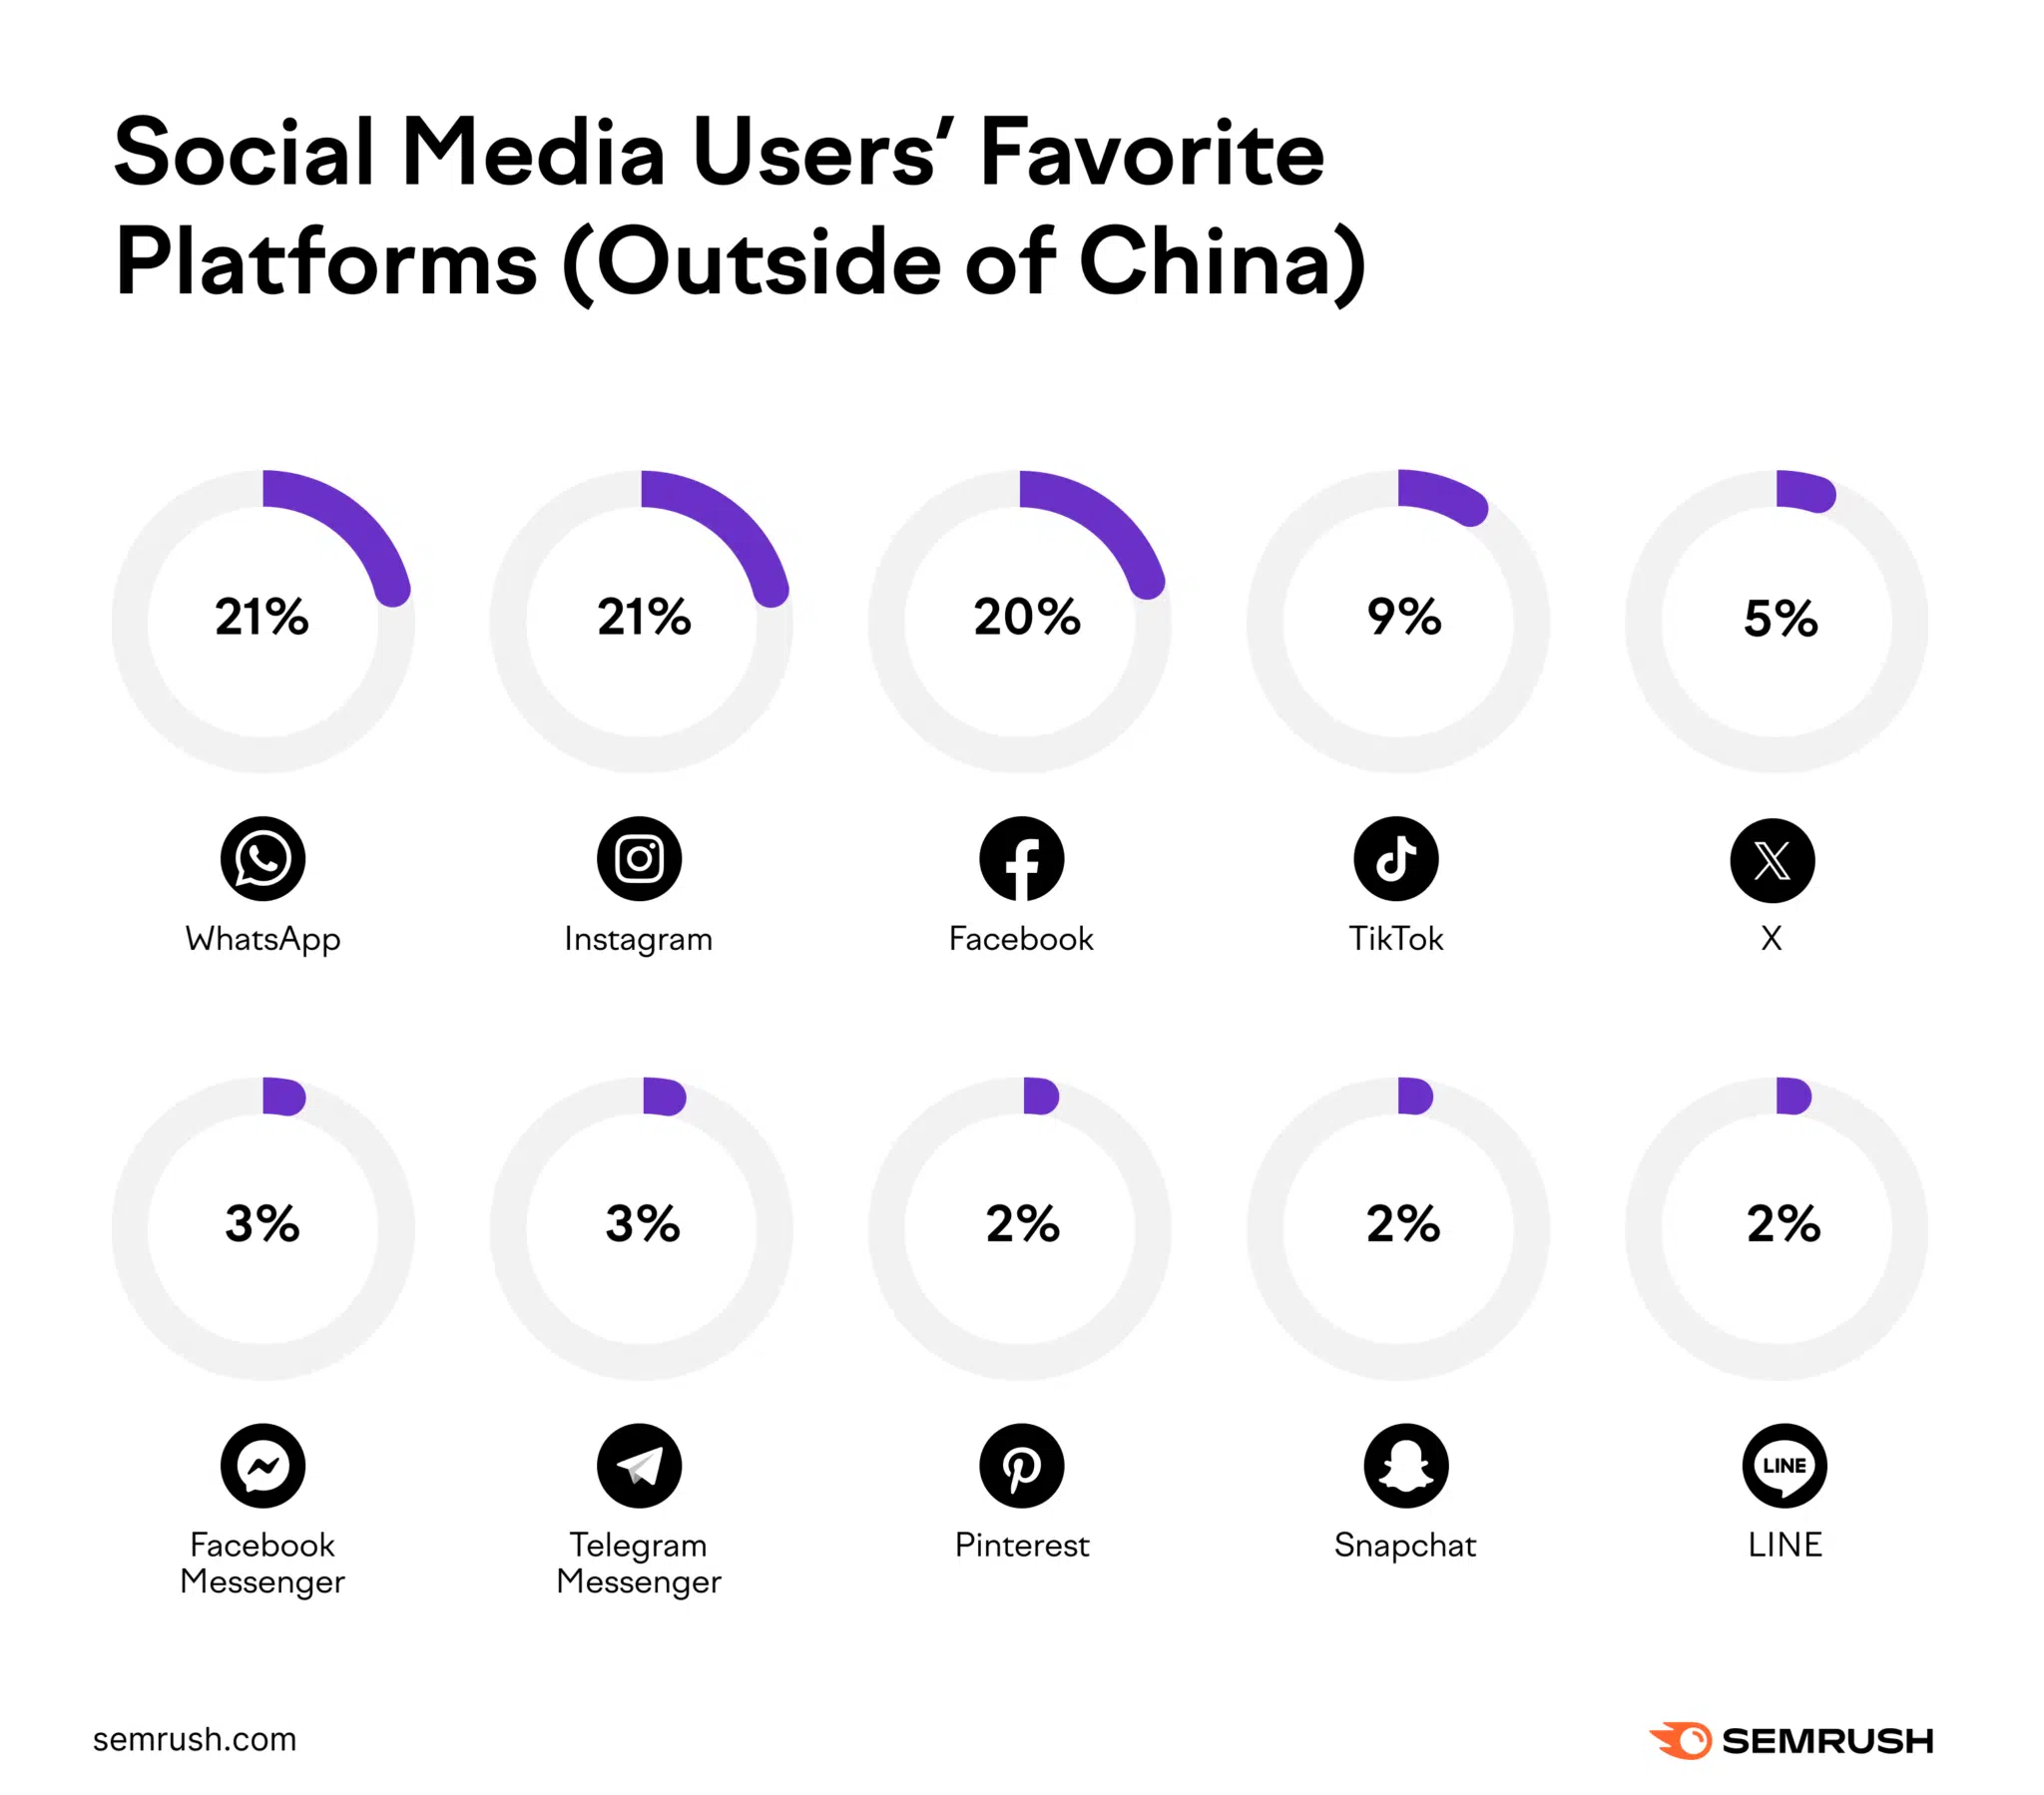
Image Source: GWI
Key takeaways
Facebook is one of most-preferred social platforms worldwide. Meaning there’s a good chance you can reach your target audience through it.
You can quickly start marketing on Facebook using tools like Semrush’s Social Poster. Which lets you create and schedule content to your Facebook page.
Start by configuring Social Poster and connecting it to your Facebook account.
Click “New post” to open the editor.

Select your Facebook page and draft your post directly in the editor. Then decide if you want to post now, schedule it, post it on a recurring basis, or save it as a draft.
Finally, select an option to save, schedule, or publish your post.

Facebook use statistics
- Facebook is the most popular social media platform worldwide (Statista, 2024)
- Monthly active Facebook users have increased 3% year-over-year (Meta, 2024)
- Over 2 billion people used Facebook daily in December 2023 (Meta, 2023)
- As of December 31, 2023, there were 3.07 billion monthly active Facebook users (Meta, 2024)
- Compared to 17% of teens who say they use TikTok almost constantly, 3% say the same about Facebook (Pew Research, 2023)
- YouTube and Facebook are the most widely used social media platforms (Pew Research, 2024)
- Every week, 1 billion people connect with a business account across Facebook messaging services (Meta, 2022)
- A whopping 98% of active Facebook users choose any kind of mobile device to access Facebook, and 16.7% users opt for both mobile devices and computers (Statista, 2022)
- Only 17% of people use Facebook to follow brands. But 88% use it to keep in contact with friends and family. (Statista, 2019)
- Of Facebook users, 14% say they use it to reach out to a brand to complain. And 27% of Facebook users say a brand should respond to a complaint within an hour. (Khoros, 2023)
- Roughly 30% of U.S. adults regularly get news from Facebook (Pew Research, 2023)
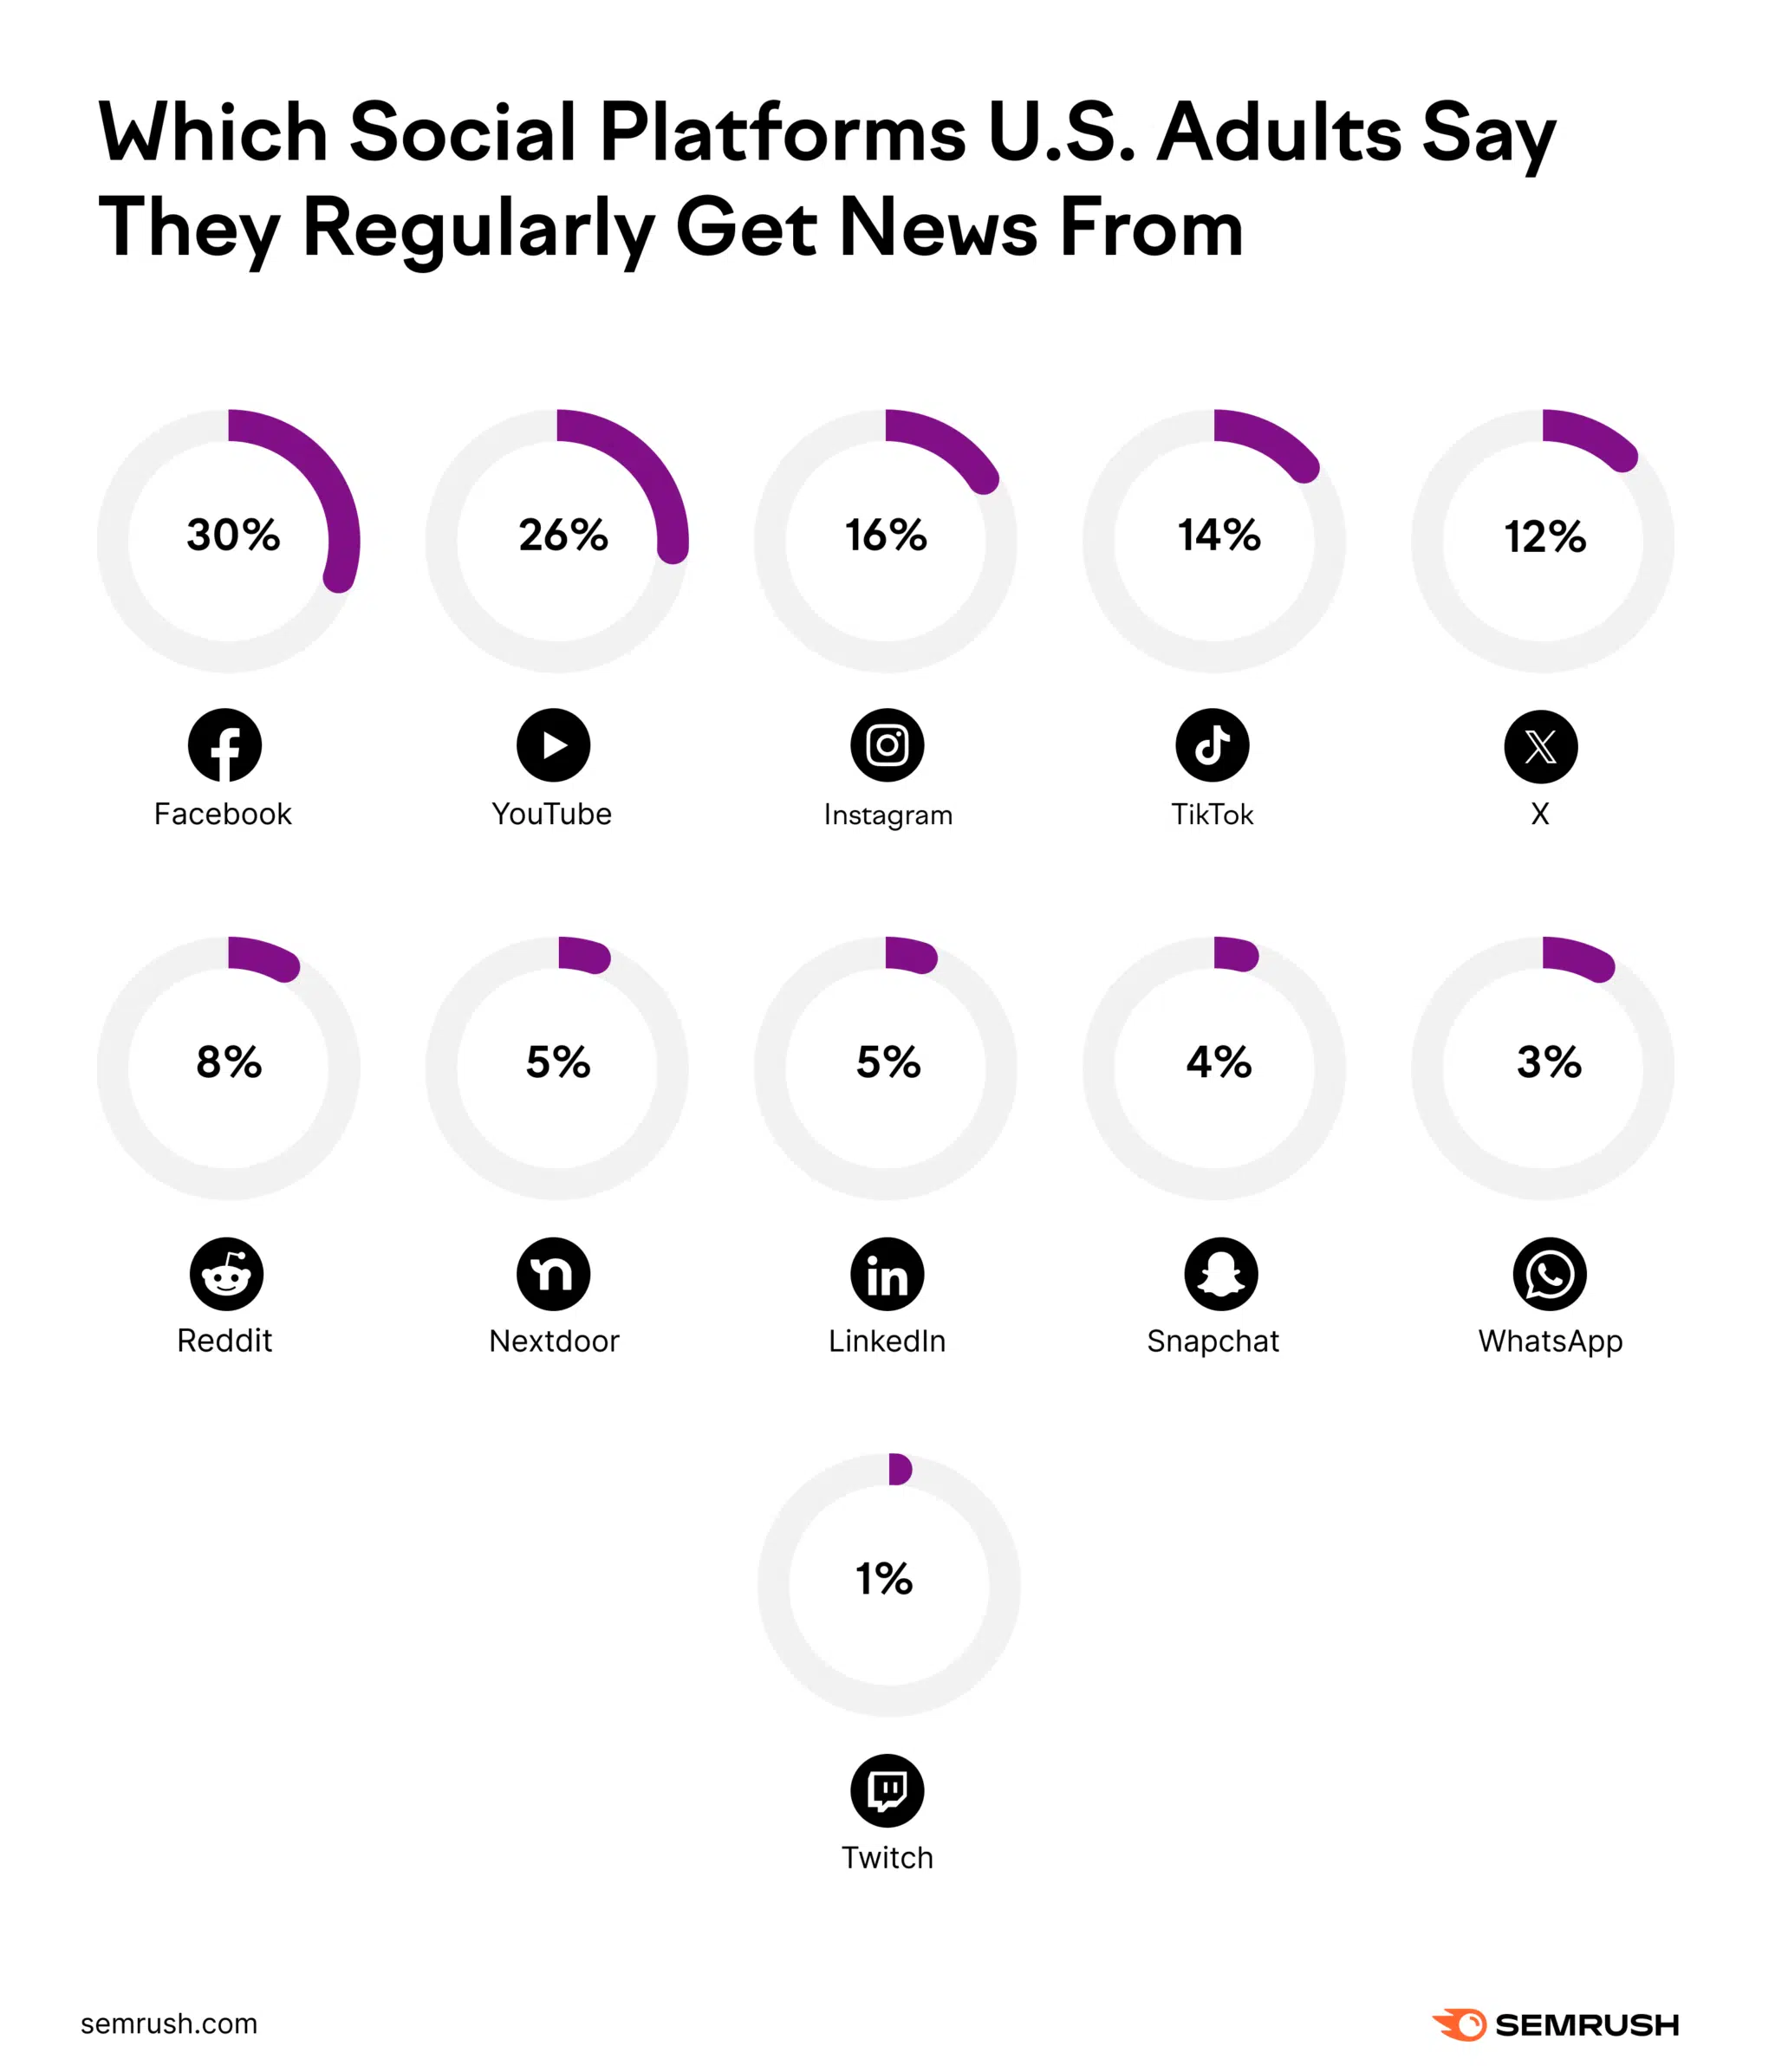
Image Source: Pew Research
Key takeaways
Users turn to Facebook for a variety of reasons, including reaching out to businesses to ask questions and share concerns. And since users expect fast replies, it’s important to devote time every day to check Messenger.
Scheduling your Facebook posts ahead of time (with a tool like Social Poster) can give you extra time each day to work through your Facebook messages. And ensure your customers remain happy.
Facebook user demographic statistics
- The share of teens who use Facebook has dropped from 71% about 10 years ago to 33% today (Pew Research, 2023)
- Facebook’s global audience is 43.2% female and 56.8% male (Statista, 2024)
- India has the most Facebook users, with 369.9 million active users. While the U.S. has 186.4 million. (DataReportal, 2023)
- Of U.S. adults who use Facebook, 68% say they earn more than $100,000/year (Pew Research, 2024)
- Facebook’s largest cohort in the U.S. is people between the ages of 25 and 34 (24.2%). And the next is people between the ages of 35 and 44 (19%). (Statista, 2024)
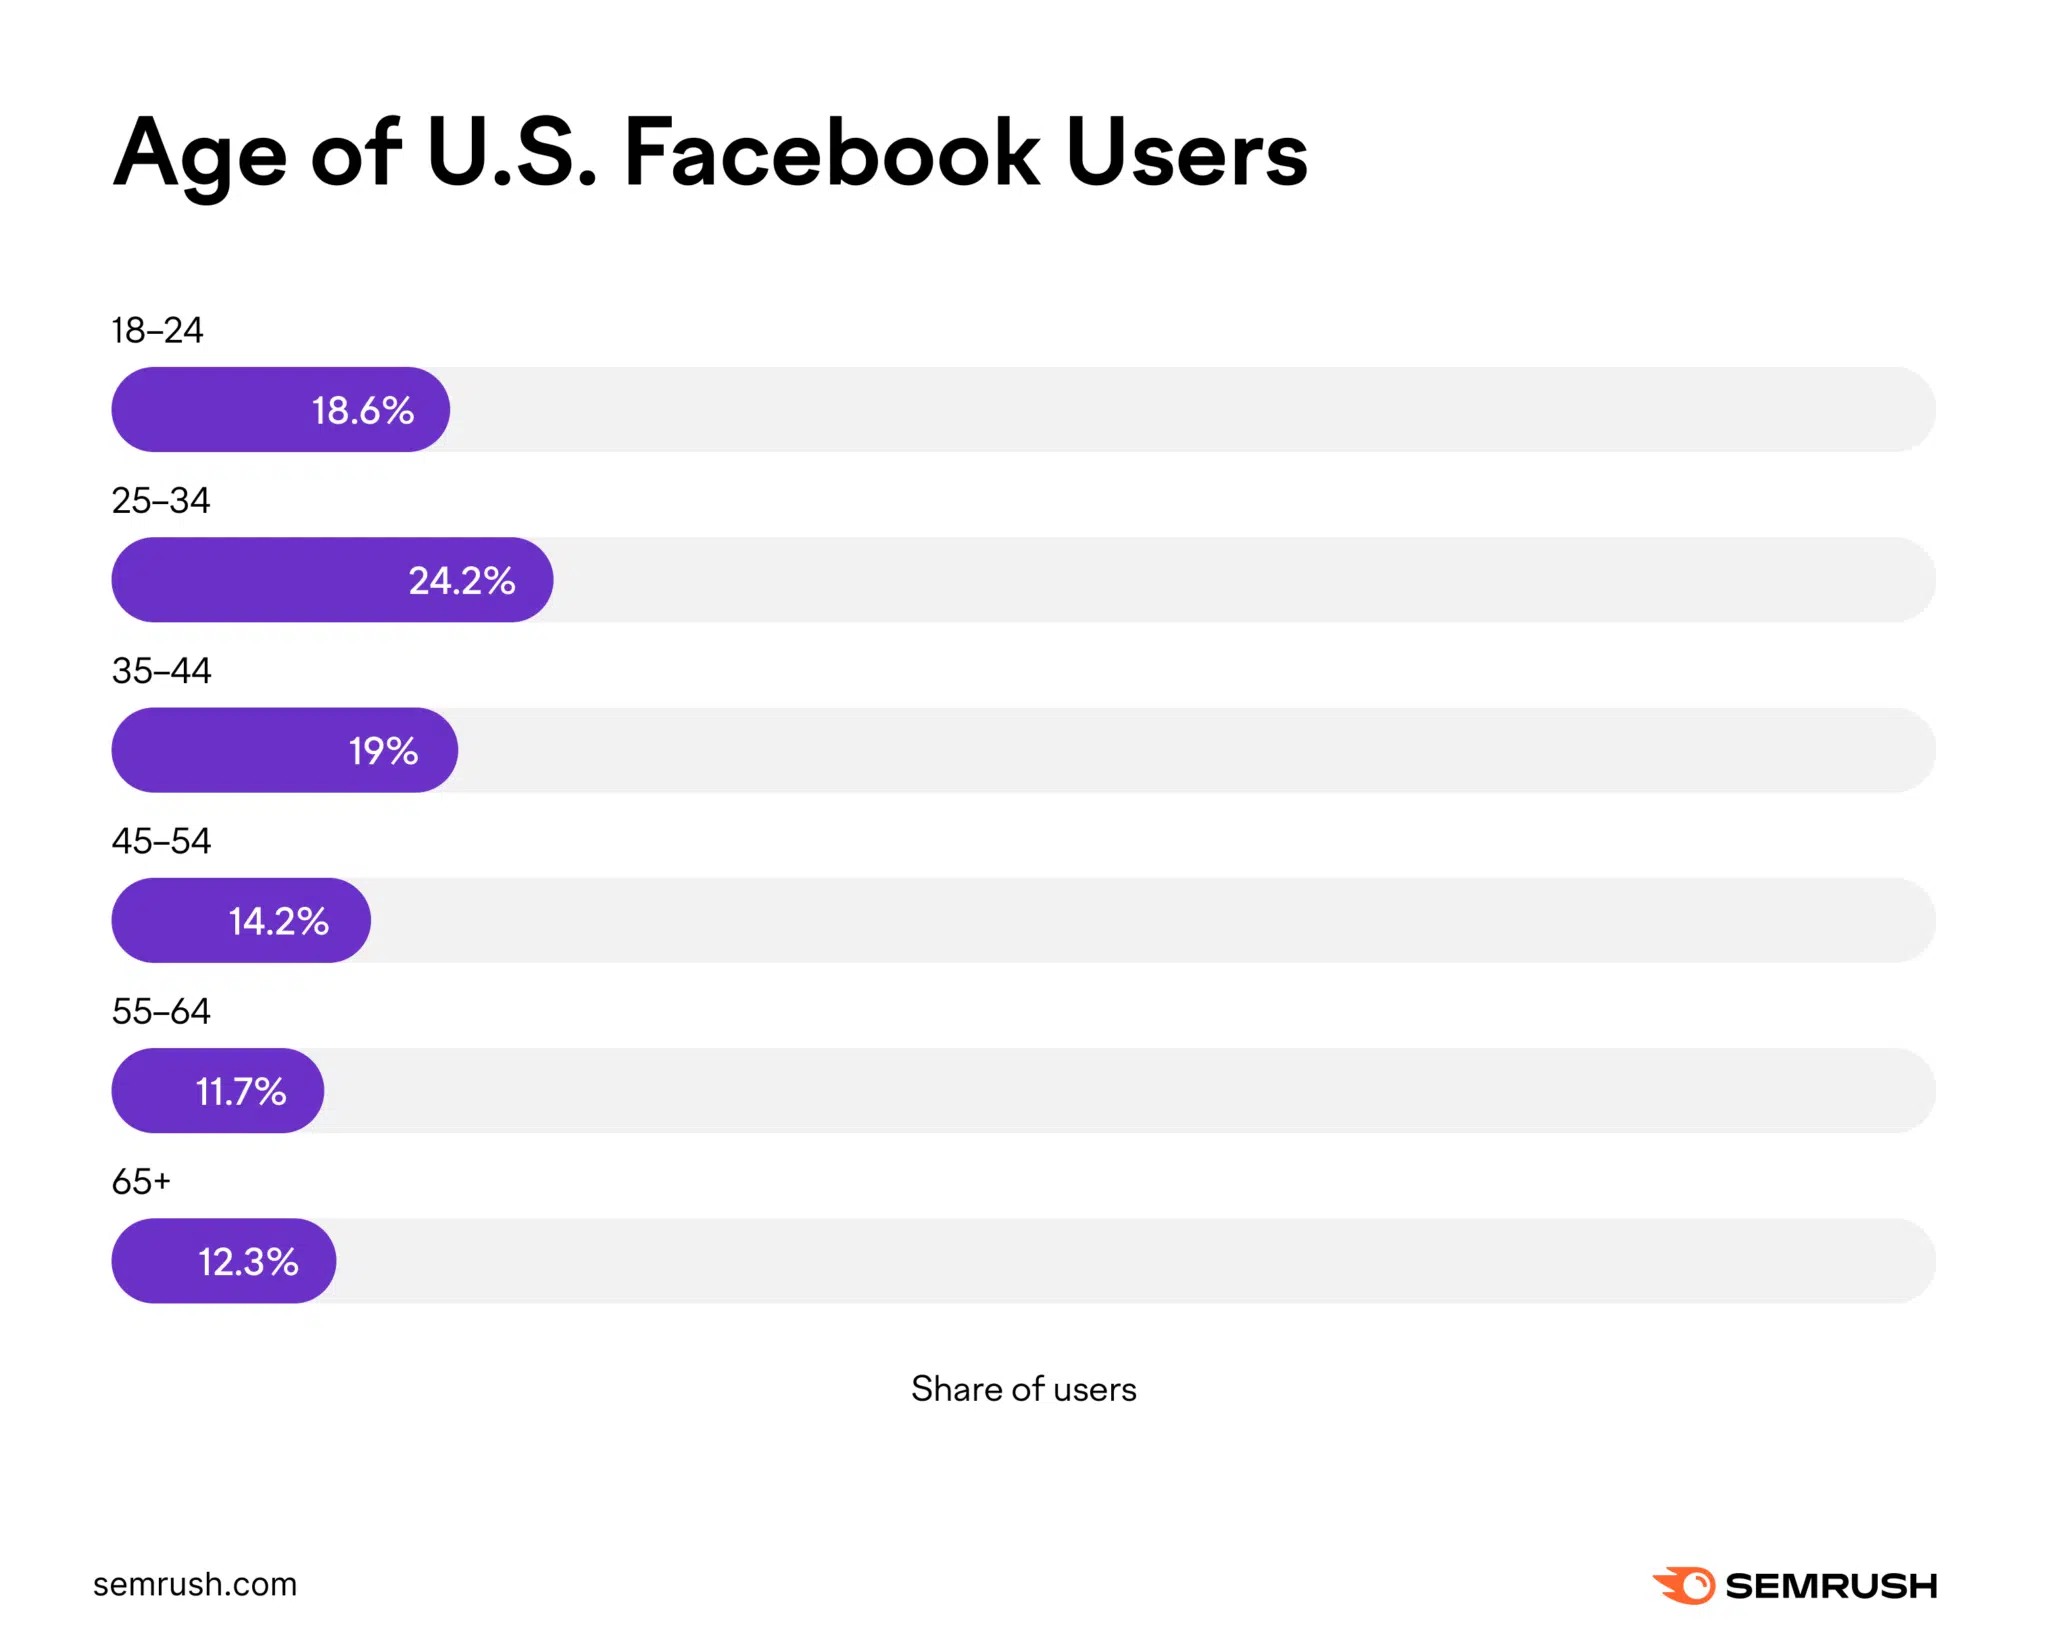
Image Source: Statista
Key takeaways
Facebook can be a good platform for businesses whose target audience is affluent and older than 25.
But businesses who want to reach a younger audience might have difficulty. As teenagers tend to prefer other platforms like Instagram and YouTube.
Facebook engagement statistics
- When asked which social media platform drives the most engagement, 22% of social media marketers say Facebook. While 23% say YouTube and another 23% say Instagram. (HubSpot, 2024)
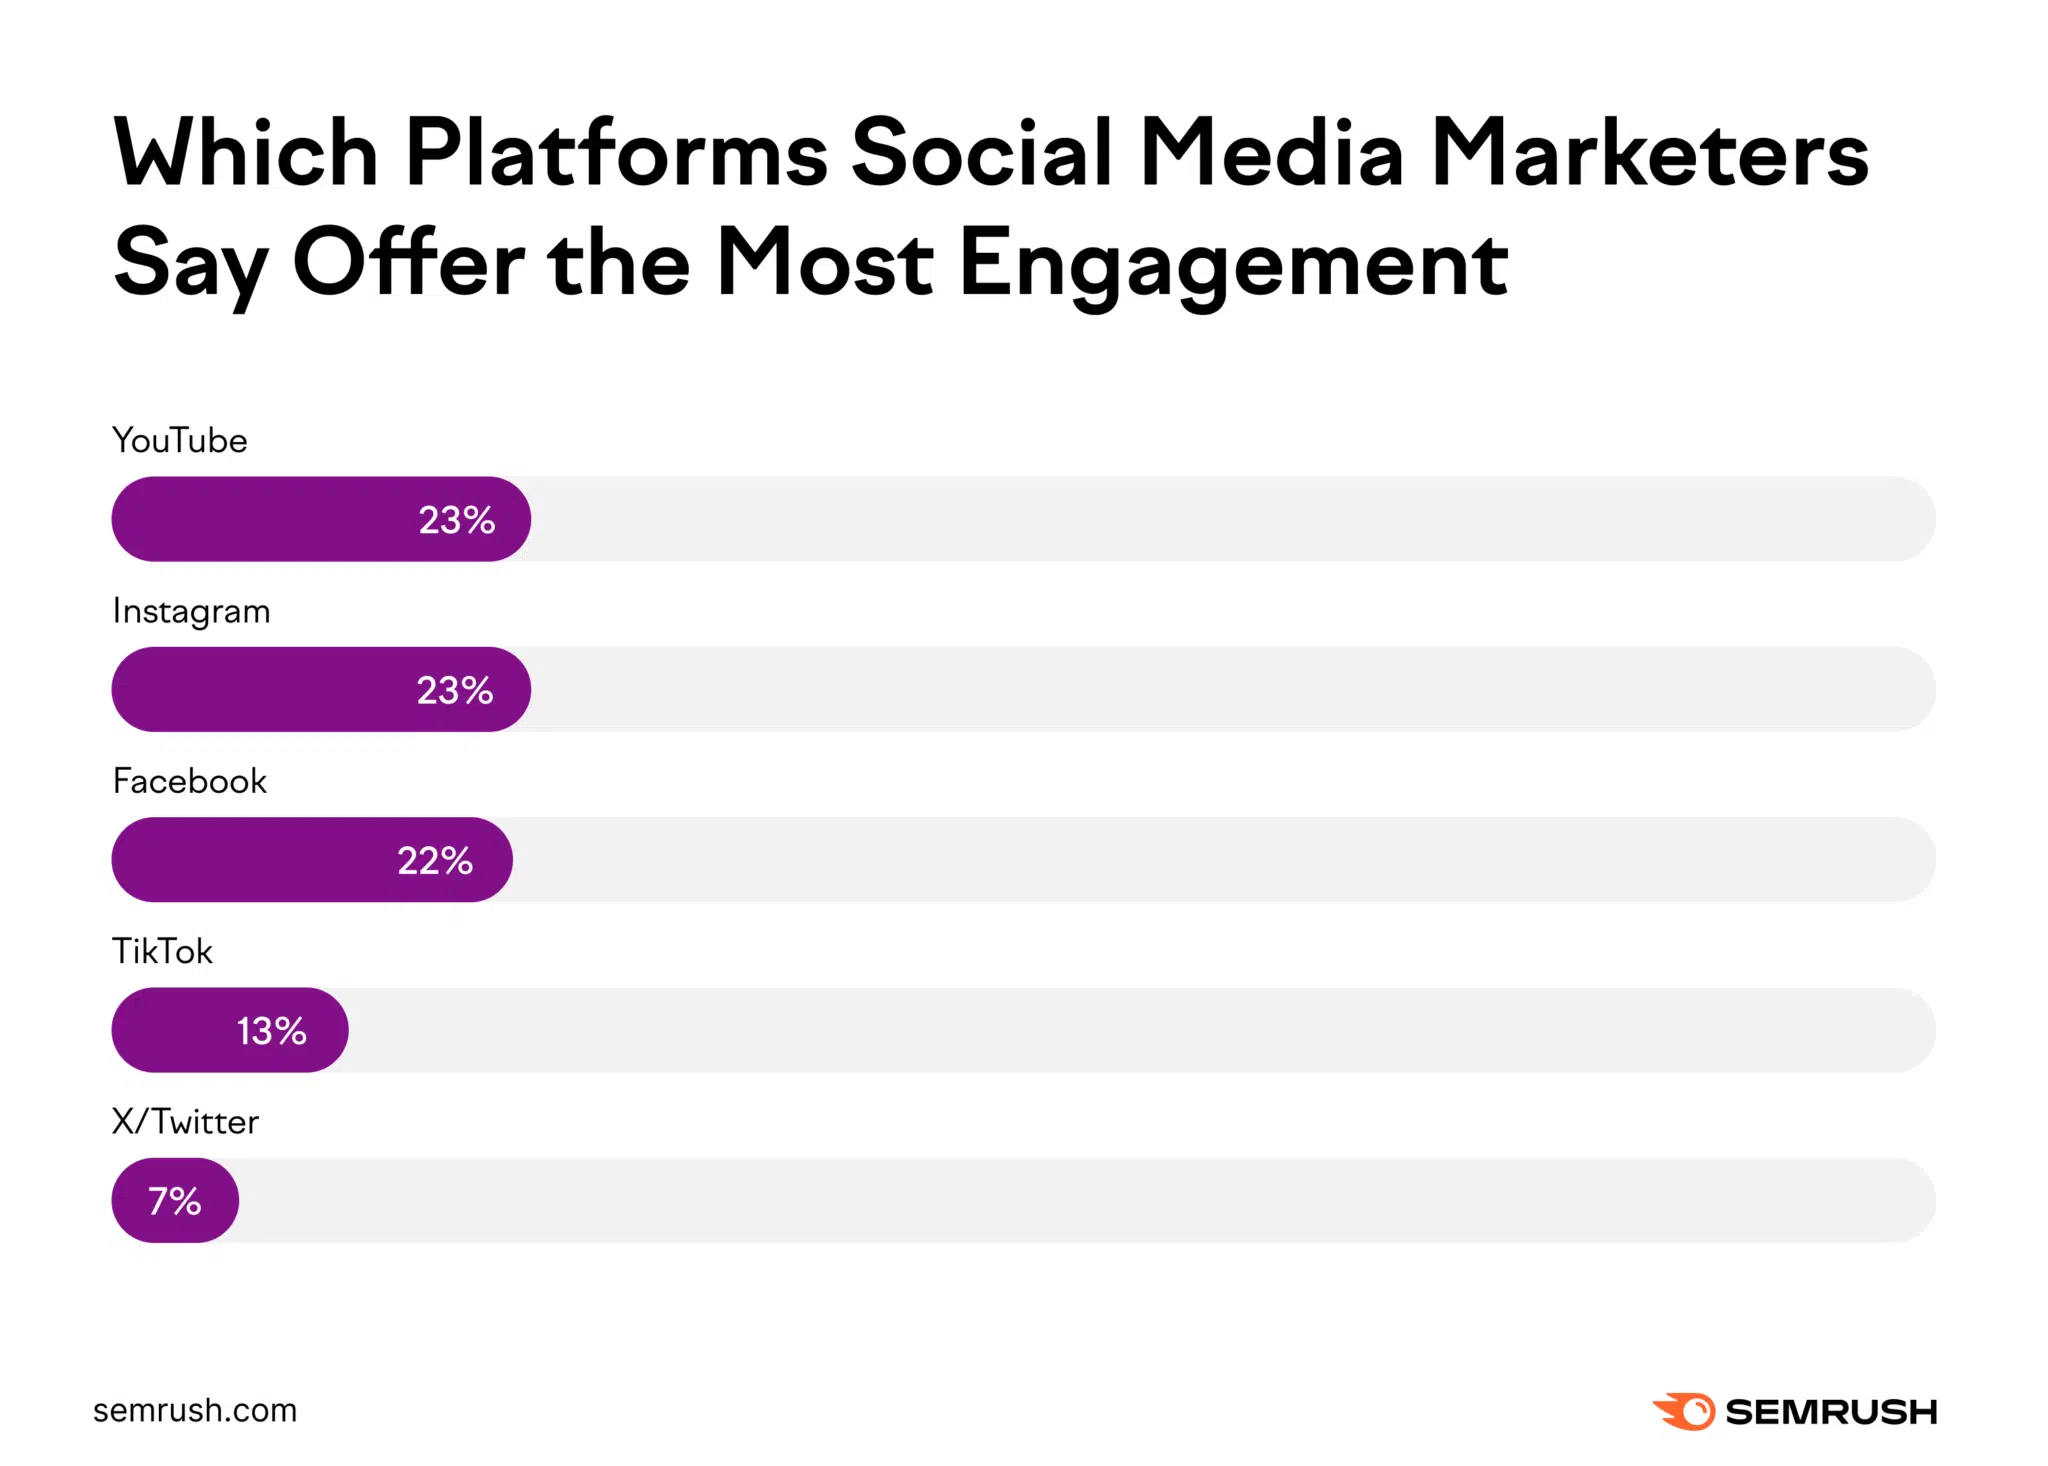
Image Source: HubSpot
- U.S. users spend an average of 30.9 minutes on Facebook per day. But TikTok is the social platform that takes up the most of their time at 53.8 minutes. (eMarketer, 2023)
- The median engagement rate on Facebook across all industries is 0.063% (RivalIQ, 2024)
Key takeaways
Although users spend less time on Facebook compared to other platforms, they tend to engage more with Facebook content. Meaning you might not have to post as frequently to generate engagement.
To learn more about which platforms may offer the best engagement, use Social Content Insights. So you can make decisions about where you should invest your time and budget moving forward.
Follow the prompts to connect your profiles and see the data.

Facebook Ads statistics
- Only 11% of B2C marketers say Facebook Ads are extremely effective in reaching content marketing goals (Content Marketing Institute, 2023)
- More than 25% of marketers say Facebook has the best audience targeting tools (HubSpot, 2024)
- Over 44% of businesses use both Google Shopping and Facebook ads (DataFeedWatch, 2022)
- Ad sets with three to 10 creatives outperform ad sets with only one and lower the median cost per action by 46% (Meta, 2023)
- There are 10 million active advertisers on Facebook (Statista, 2020)
- Ad impressions increased 28% year over year in 2023 for Meta’s Family of Apps (all the apps Meta owns, including Facebook) (Meta, 2024)
- In 2023, the average price for ads within Meta’s Family of Apps decreased 9% per ad year over year (Meta, 2024)
- About 68% of businesses say video ads drive more clicks than image ads on Facebook (DataBox, 2023)
- More than 60% of marketers spend between $1 and $500 per month on Facebook ads (WebFX, 2024)
- Ecommerce Partnership Ads have 20% more conversions per dollar compared to non-partnership ads (Meta, 2024)
- The average click-through-rate for Facebook ads is 2.50% (WordStream, 2024)
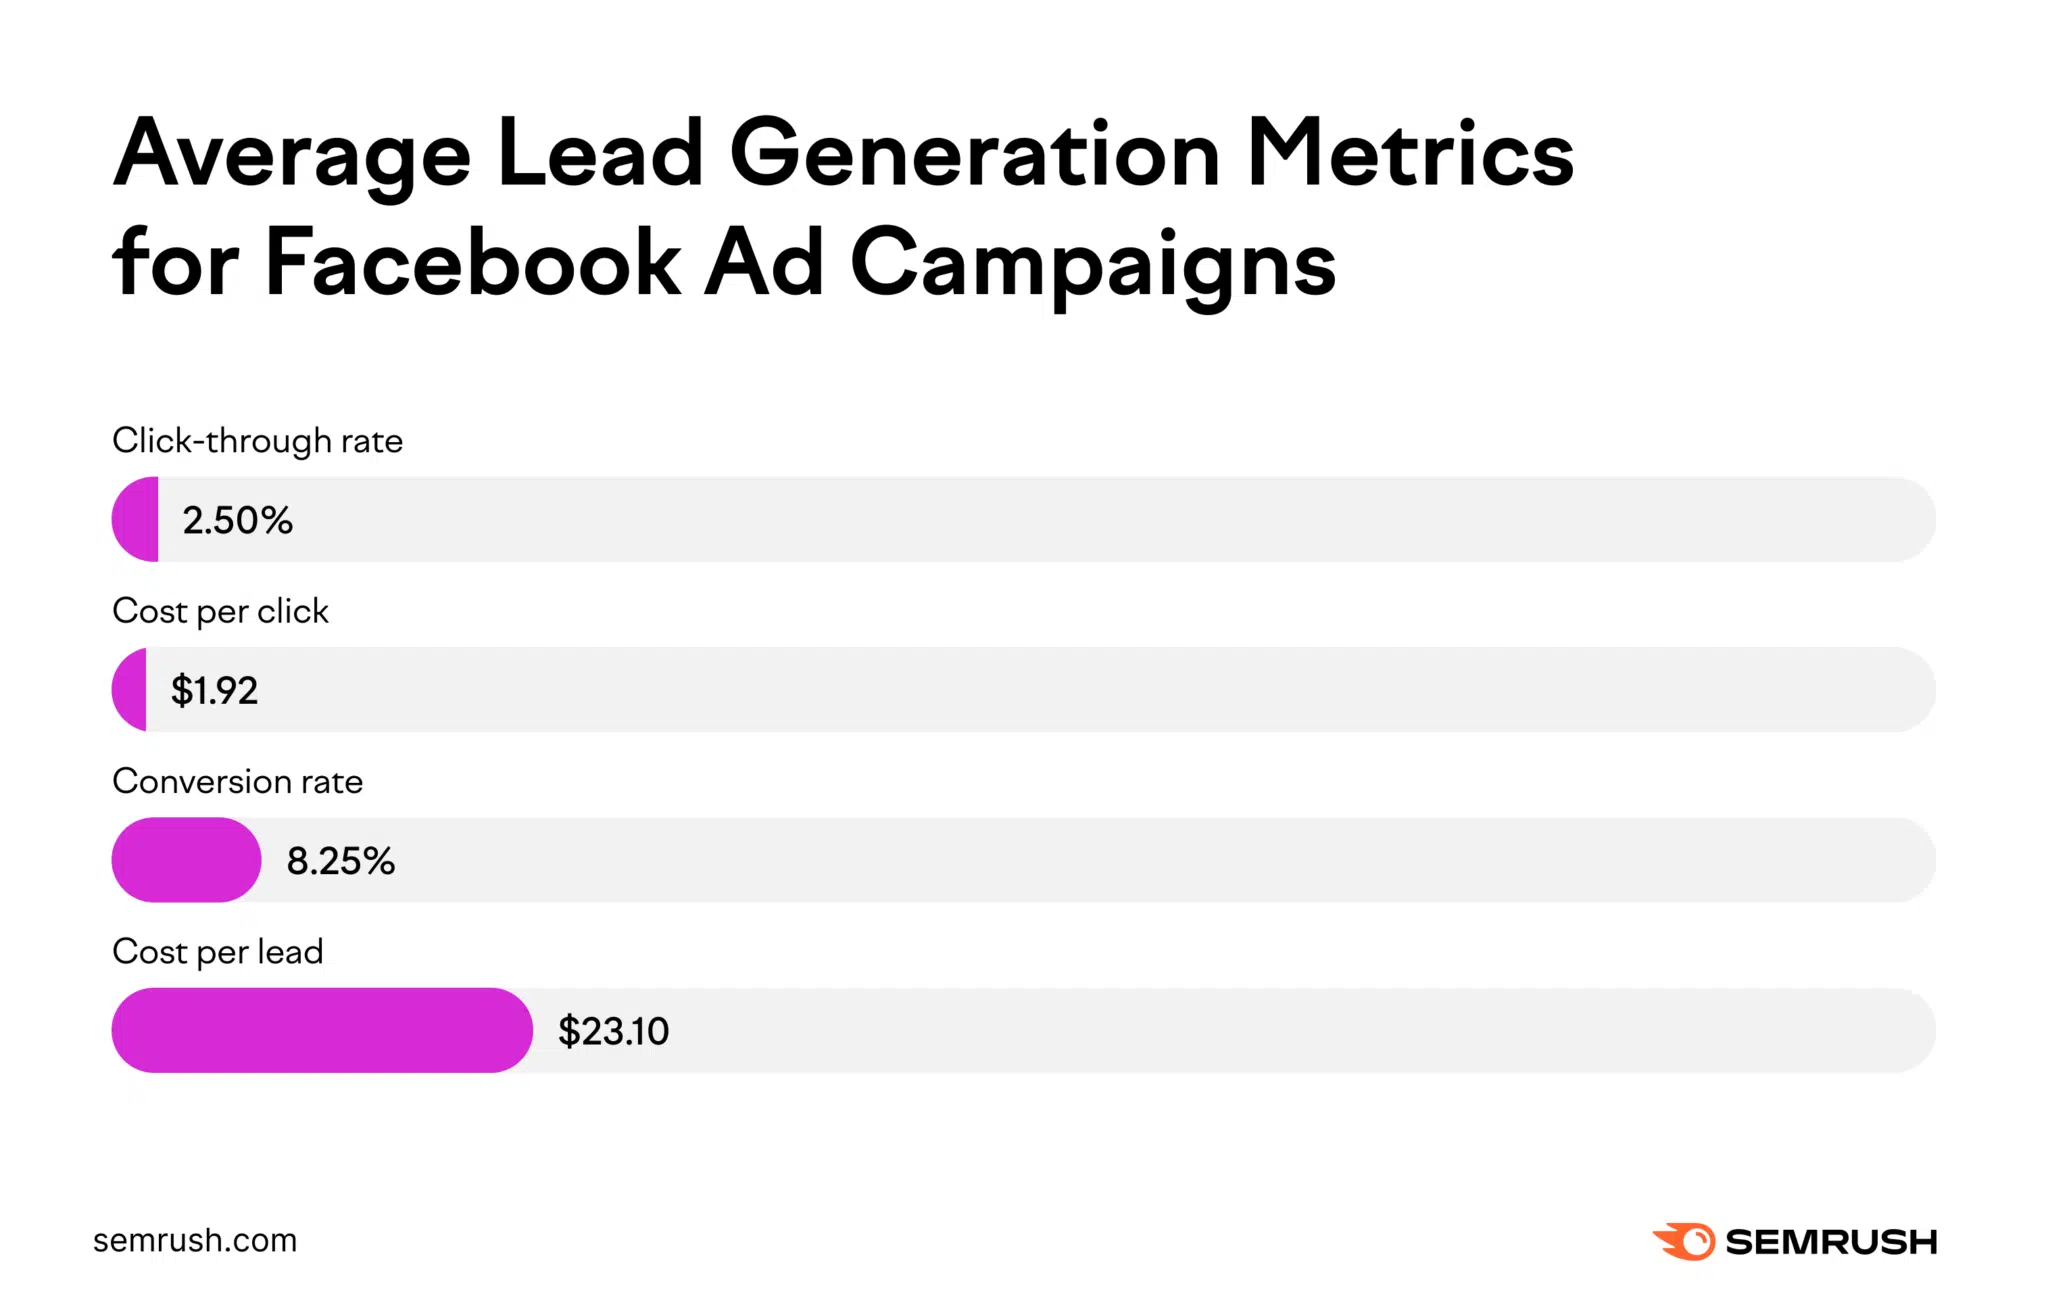
Image Source: WordStream
- Nearly 90% of B2C marketers say Facebook is one of the platforms they’ve used in the past year for organic content marketing (Content Marketing Institute, 2023)
- Facebook’s ad reach exceeds Instagram’s and TikTok’s (DataReportal, 2024)
Key takeaways
With average ad prices declining, now may be an ideal time for businesses to start using Facebook ads.
The AdCreative.ai app helps you put together high-converting creative for your ads. Including copy, imagery, and videos.
Once you’ve opened the app, it will prompt you to set up your brand.
Enter your URL or enter your details manually. And when you’re finished, click “Create Brand.”

Then, choose what you’d like to create. Like ad creative, product photos, text, videos, etc.
Each selection leads you through simple prompts that will help the AI generate conversion-focused assets.

Facebook marketing statistics
- Of surveyed social media marketers, 22% say Facebook has the best ROI of all social platforms. That puts it behind YouTube (25%) but ahead of Instagram (21%) and TikTok (14%). (HubSpot, 2024)
- The average number Facebook posts brands put out each week is 4.69 (Statista, 2023)
- Over 20% of marketing professionals find Facebook effective for influencer marketing (Meltwater, 2024)
- Of surveyed social media marketers, 18% say Facebook offers brands the biggest opportunity to grow their audiences in 2024 (HubSpot, 2024)
- Nearly 30% of B2B marketers say Facebook delivers the best value for their organizations (Content Marketing Institute, 2024)
- Over 30% of marketers say Facebook is the social platform that contributes the most to their sales (Social Media Examiner, 2024)
- Over half of B2B and nearly three quarters of B2C companies use Facebook for social media marketing (HubSpot, 2024)
- One quarter of marketers say Facebook is the best place for growing a community (HubSpot, 2023)
- Over 20% of brands say they plan to invest the most in Facebook in 2024 (HubSpot, 2024)
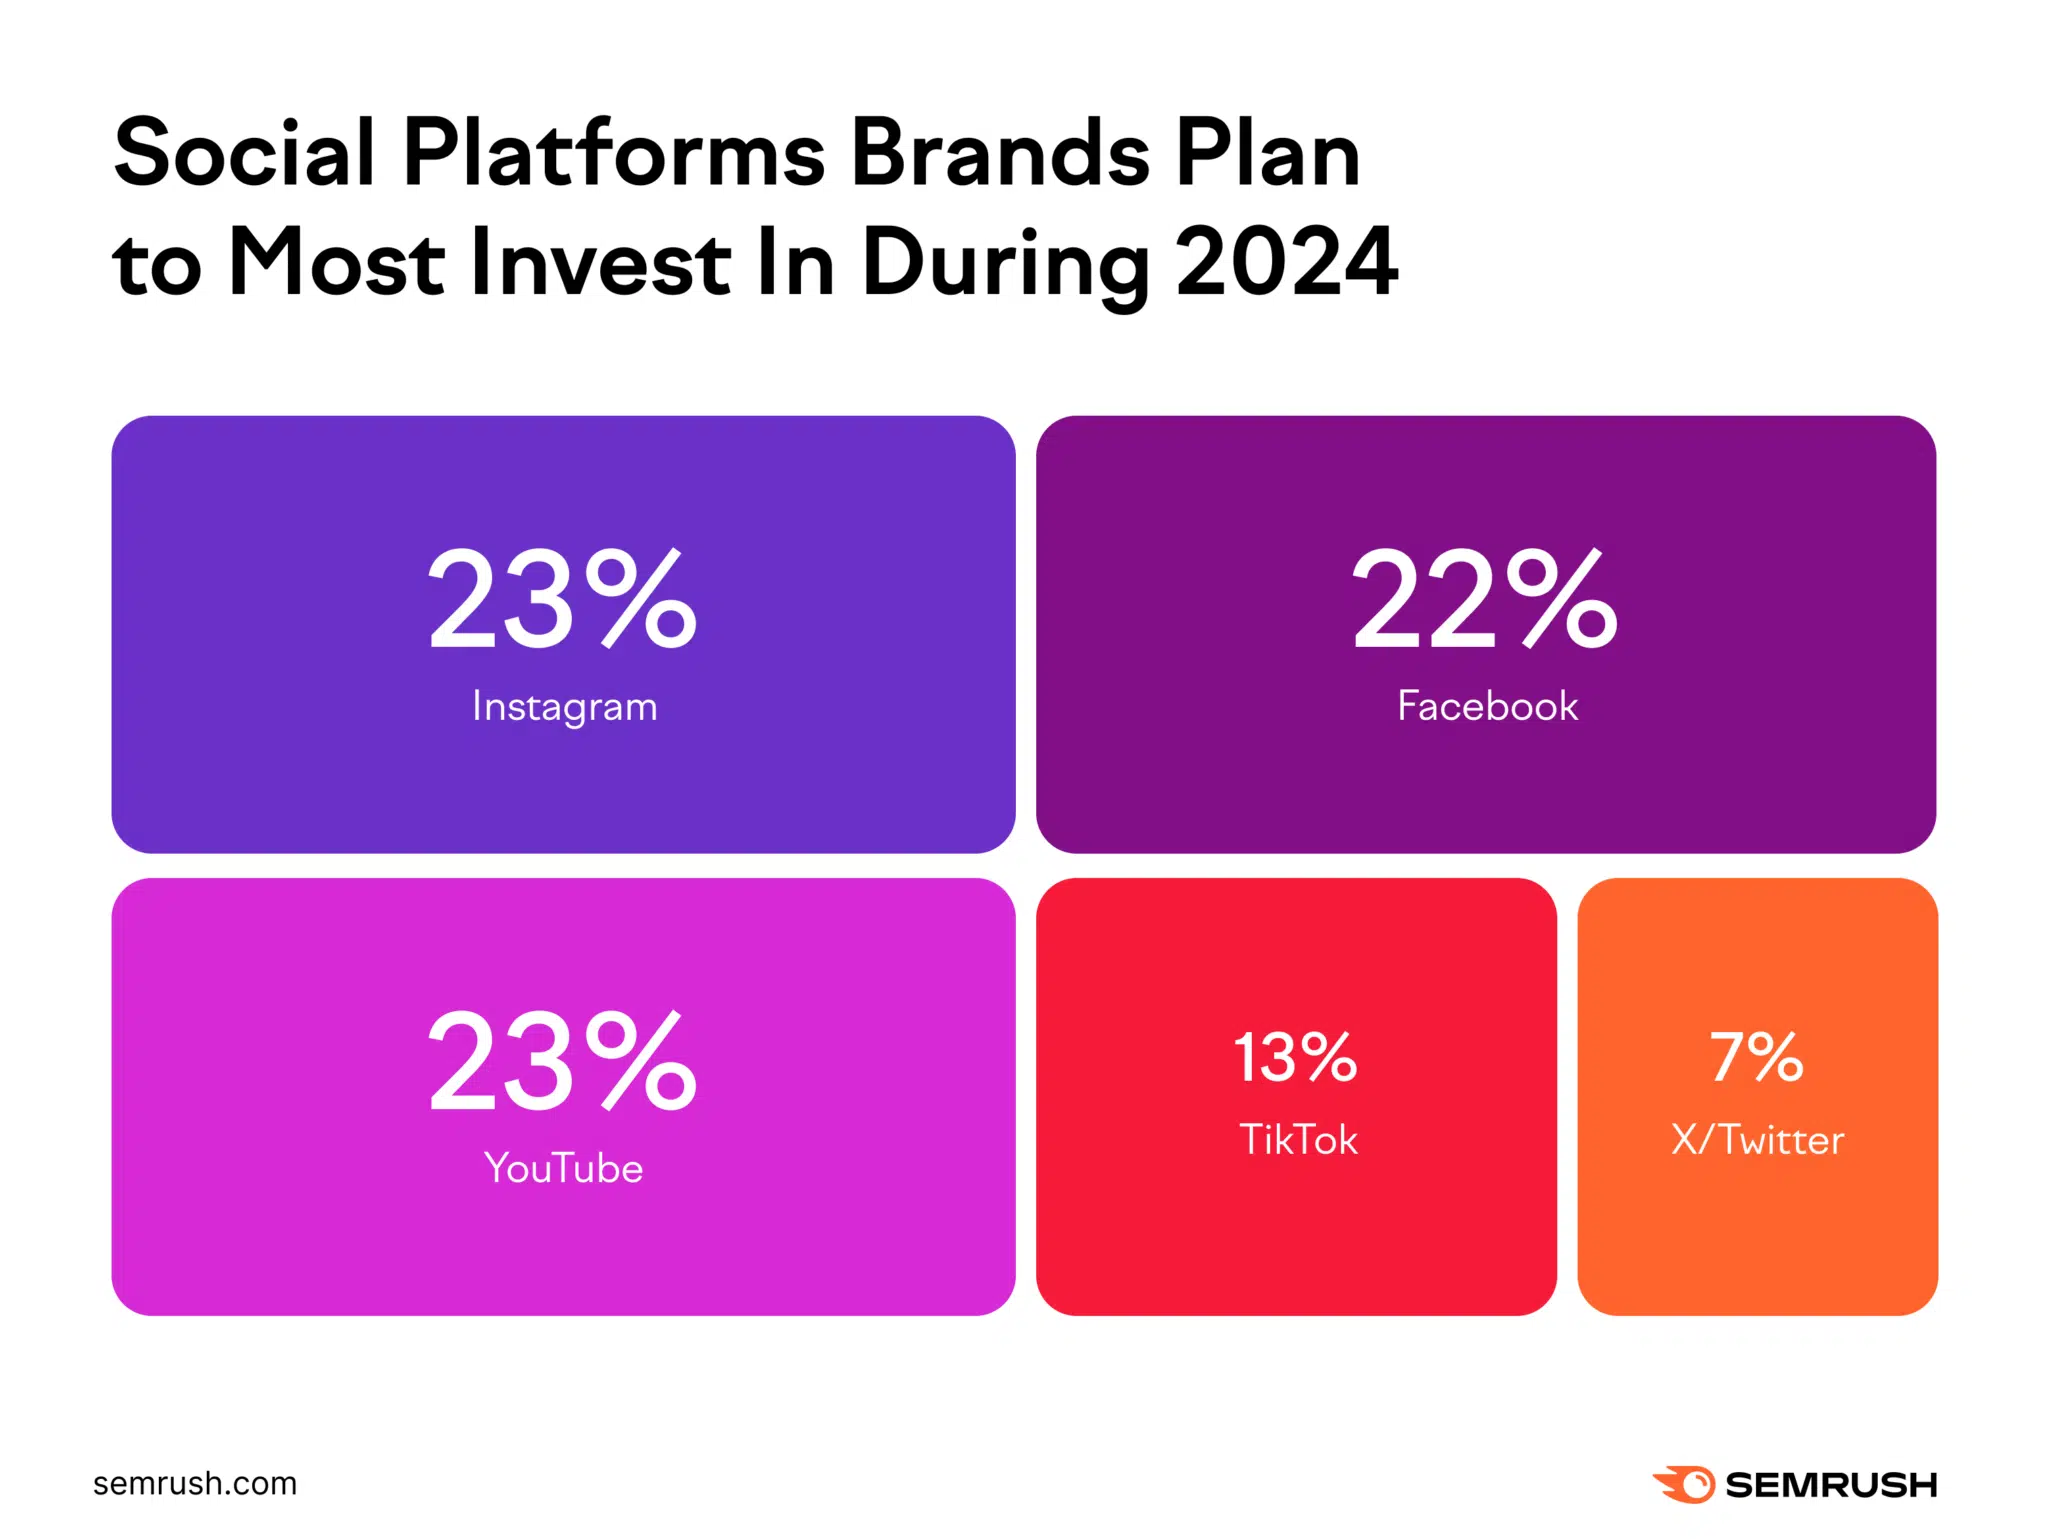
Image Source: HubSpot
Key takeaways
Facebook may offer high audience growth and ROI, but that growth depends on your strategy, your competitors, and your industry. And growth isn’t guaranteed.
But researching what competitors post (and which posts get the most engagement) can give your business the best chance of growing on Facebook.
Social Tracker compiles data on your competitors. So you can quickly review things like their top posts.
To get started, configure Social Tracker.
Then, click into the “Facebook” tab. You can view insights on posts, audience, activity, engagement, and hashtags related to competitors’ Facebook posts.

Review posts with the highest engagement and look for commonalities.
For example, you might notice that posts featuring customer testimonials get higher engagement. So, you may want to experiment with posting testimonials to your Facebook page.
Facebook shopping statistics
- Facebook Marketplace had more than 1 billion monthly users in 2021 (Statista, 2022)
- Nearly 50% of U.S. adults are likely to make a purchase directly on Facebook (Jungle Scout, 2023)
- Almost 40% of people in North America say they’ve used Facebook Marketplace/Instagram Shopping in the last month (GWI, 2023)
- Facebook is expected to reach 64.6 million social commerce buyers within 2024 (eMarketer, 2023)
- The projected combined revenue from social commerce on Facebook and Instagram in 2024 is $94 million (Statista, 2024)
- Facebook and Instagram are the most popular social media platforms for buying products (Statista, 2023)
- Over one quarter of online shoppers cite Facebook as the social network they’re most likely to shop on (Statista, 2023)
Key takeaways
With so many people looking to buy products through Facebook, ecommerce businesses can benefit from setting up Shops on Facebook.
Here’s PetSmart’s Facebook Shop:

Shops is free to use and lets businesses sell products directly within the Facebook and Instagram apps. Making it easier for your customers to buy your products as they scroll social media.
Facebook video statistics
- Facebook is the second-most widely used platform for video marketing. (YouTube is first.) (Wyzowl, 2024)
- Among surveyed consumers, 40% say they use Facebook to share videos (HubSpot, 2024)
- More than half of marketers plan to increase their video marketing on Facebook going forward (Social Media Examiner, 2024)
- People spend 50% of their time on Facebook and Instagram watching videos (Meta, 2021)
- Over 2 billion people watch in-stream-eligible videos (videos that can use in-stream ads) on Facebook each month (Meta, 2021)
- Live videos receive the most interaction of any post type on Facebook. They receive about three times more interactions than the second-most popular post type (carousels). (Emplifi, 2023)
- Over 70% of marketers report Facebook as being an effective platform for video marketing (Wyzowl, 2024)
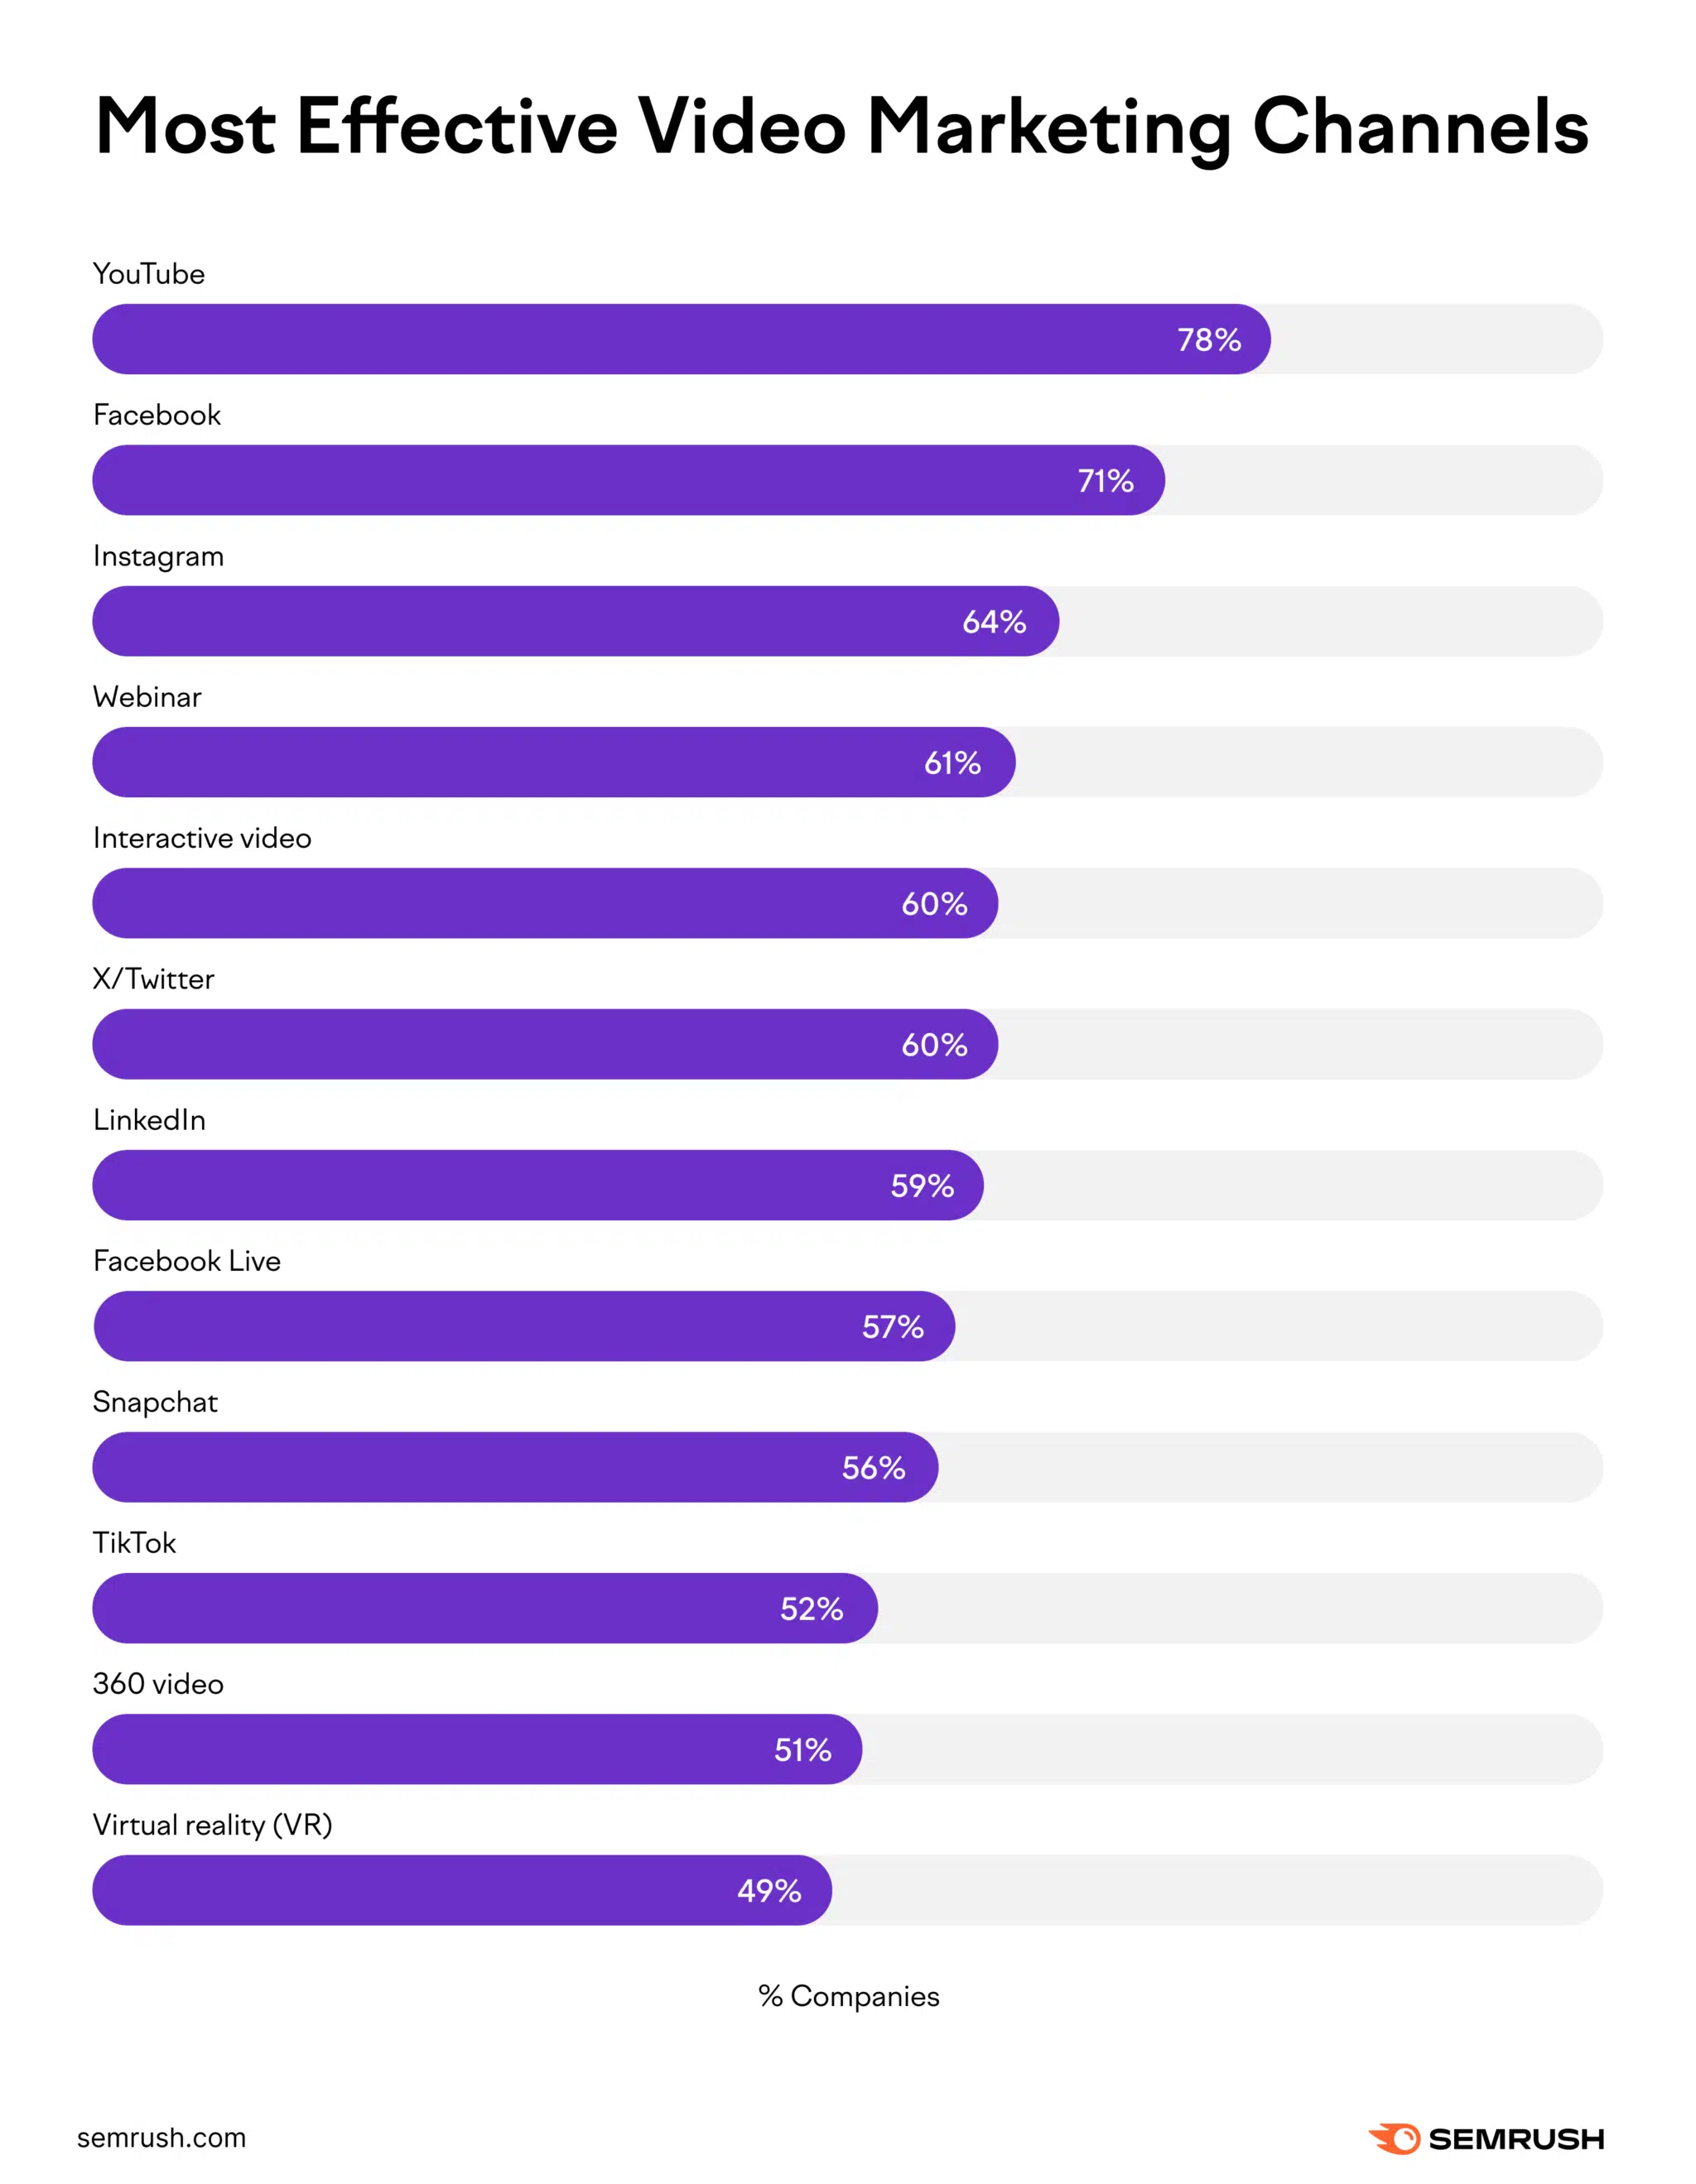
Image Source: Wyzowl
Key takeaways
Facebook is a strong contender when it comes to video marketing, including video ads.
And you don’t need to be a videographer to create high-converting videos for Facebook. The AI Video Marketing Automator app automatically creates videos for you.
For example, you can enter a prompt and have AI generate a video for you. Then, you can make any adjustments to suit your needs. Like changing the voice, style, music, media, or subtitles. Or ask AI to make changes for you.

Scale your Facebook marketing
Facebook offers businesses the chance to grow both their follower bases and drive business goals. And Semrush has tools to help you at each step along the way:
- Use Social Poster to schedule your Facebook posts
- Use Social Tracker to analyze the competition and see what works for them (so you can build an even better strategy)
- Use Social Analytics to track growth, post reach, engagement, and more
Ready to grow your business?
Try Semrush Social for free.
New on Search Engine Land