Bing Launches In-Depth Industry Ad Visualizations Across Devices, Time & Location
New visualizations from Bing Ads will help advertisers garner industry information in a quick (& beautiful) format.

When it comes to providing advertiser data, Bing is on a roll. Last month Bing released in-depth demographic and reach data with slick charts and graphs. Today the Bing Ads Marketplace Trends Interactive Website was announced. It’s a tool that will help marketers gather more data across specific industry verticals.
The targeting parameters that Bing reports on are very helpful; this addition should be well received by advertisers. The three main trend reports cover time and ad scheduling trends, device targeting trends and location targeting trends.
Device Targeting Trends
This chart displays both CTR and CPC information by industry/subindustry across desktop/table/mobile devices.

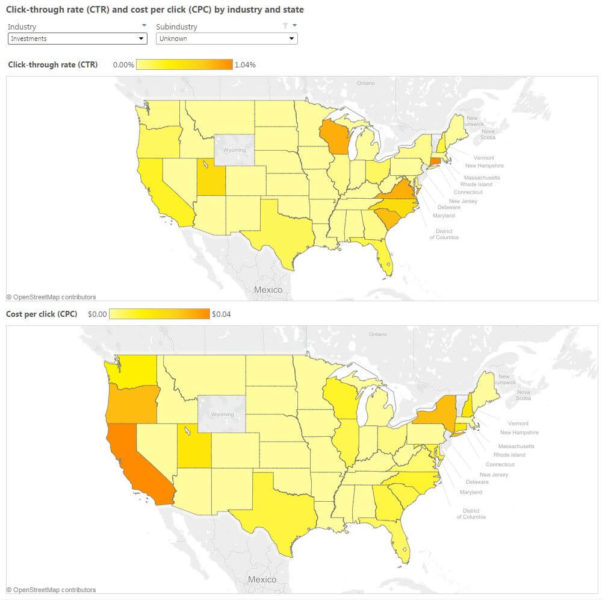
Location Targeting Trends
This interactive map displays CPC and CTR by state in a visual heatmap display.
Ad Scheduling Trends
One of the most powerful visual tools in the suite shows volume across device/day of week/hour of the day. This is also filterable by industry/subindustry.

To see these visualizations in action, head on over to the Bing Ads Marketplace Trends Interactive Website.
Contributing authors are invited to create content for Search Engine Land and are chosen for their expertise and contribution to the search community. Our contributors work under the oversight of the editorial staff and contributions are checked for quality and relevance to our readers. The opinions they express are their own.
Related stories
New on Search Engine Land
About the author