Temu revenue and usage statistics
Temu is a popular shopping marketplace known for its ultra-low prices owned by PDD Holdings.
Launched in 2022, the platform quickly gained a massive following thanks to significant marketing investments and a gamified shopping concept with tons of deals.
Today, the Temu mobile app has more than 416 million monthly active users, and annual sales are estimated at $70.8 billion.
Continue reading to find the latest statistics on Temu usage in 2026.
Key Temu stats
- Temu has 416.5 million monthly active users worldwide.
- In the US, 133.6 million users access the Temu mobile app at least once a month.
- In the EU, Temu has 141.6 million monthly active users.
- Temu’s gross merchandise value reached $70.8 billion in 2024.
Temu monthly active users worldwide
According to the latest data, the Temu app has over 416.5 million monthly active users worldwide.

That’s up from 167 million monthly active users in Q1 2024. In Q1 2023, Temu had 23.4 million monthly active users in Q1 2023.
Note: Data above includes data from multiple sources and may not be comparable.
Source: Investor’s Business Daily, European Commission, Similarweb, Investing
Temu monthly active users in the US
As of October 2025, Temu has 133.6 million monthly active users in the US, showing a 28% year-over-year decrease.

Source: Similarweb, Investing
Temu monthly active users in the UK
Temu had 13.1 million monthly active users in the UK, up a 16.3% year-over-year increase.

Source: Similarweb
Temu monthly active users in the EU
According to company data, Temu has 141.6 million monthly active users in the European Union. That’s an increase of 74% year-over-year.

In 2025, the EU accounts for 34% of Temu’s global user base.
Source: European Commission, Investing
Temu app downloads worldwide
The number of Temu app downloads worldwide reached 1.0 billion in the second quarter of 2025.
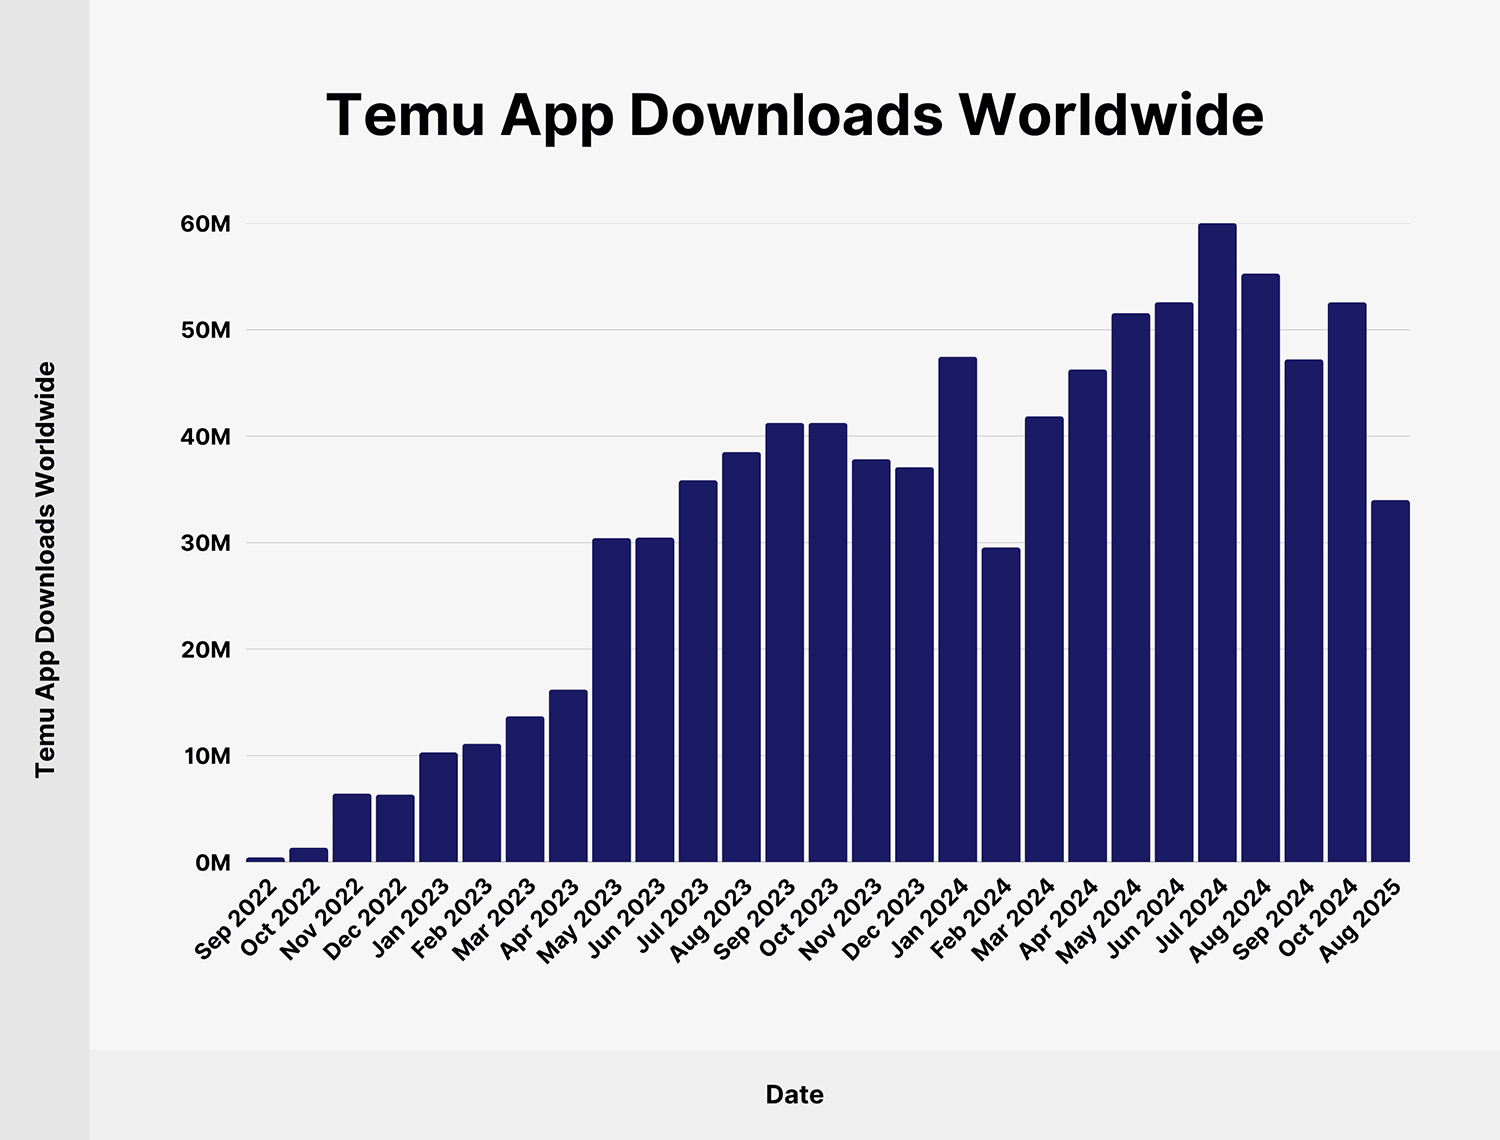
In 2024, Temu downloads reached 484.31 million across the App Store and Google Play worldwide.
Here’s a detailed breakdown of Temu monthly app downloads since September 2022:
| Date | Temu App Downloads Worldwide |
|---|---|
| September 2022 | 0.43 million |
| October 2022 | 1.35 million |
| November 2022 | 6.44 million |
| December 2022 | 6.34 million |
| January 2023 | 10.29 million |
| February 2023 | 11.12 million |
| March 2023 | 13.69 million |
| April 2023 | 16.2 million |
| May 2023 | 30.43 million |
| June 2023 | 30.47 million |
| July 2023 | 35.86 million |
| August 2023 | 38.52 million |
| September 2023 | 41.25 million |
| October 2023 | 41.25 million |
| November 2023 | 37.84 million |
| December 2023 | 37.09 million |
| January 2024 | 47.46 million |
| February 2024 | 29.55 million |
| March 2024 | 41.86 million |
| April 2024 | 46.26 million |
| May 2024 | 51.55 million |
| June 2024 | 52.59 million |
| July 2024 | 60 million |
| August 2024 | 55.26 million |
| September 2024 | 47.21 million |
| October 2024 | 52.57 million |
| June 2025 | 113 million |
Average time spent with temu app
According to the latest available data, Temu users spent an average of 21 minutes per day in the mobile app.

To put it in perspective, that’s more daily minutes than on AliExpress (11 minutes), eBay (11 minutes), or Amazon (10 minutes).
Source: Bloomberg, MarketMaze
Temu sales worldwide
Temu sales in 2024 reached an estimated $70.8 billion, surpassing annual sales of $18 billion in 2023.
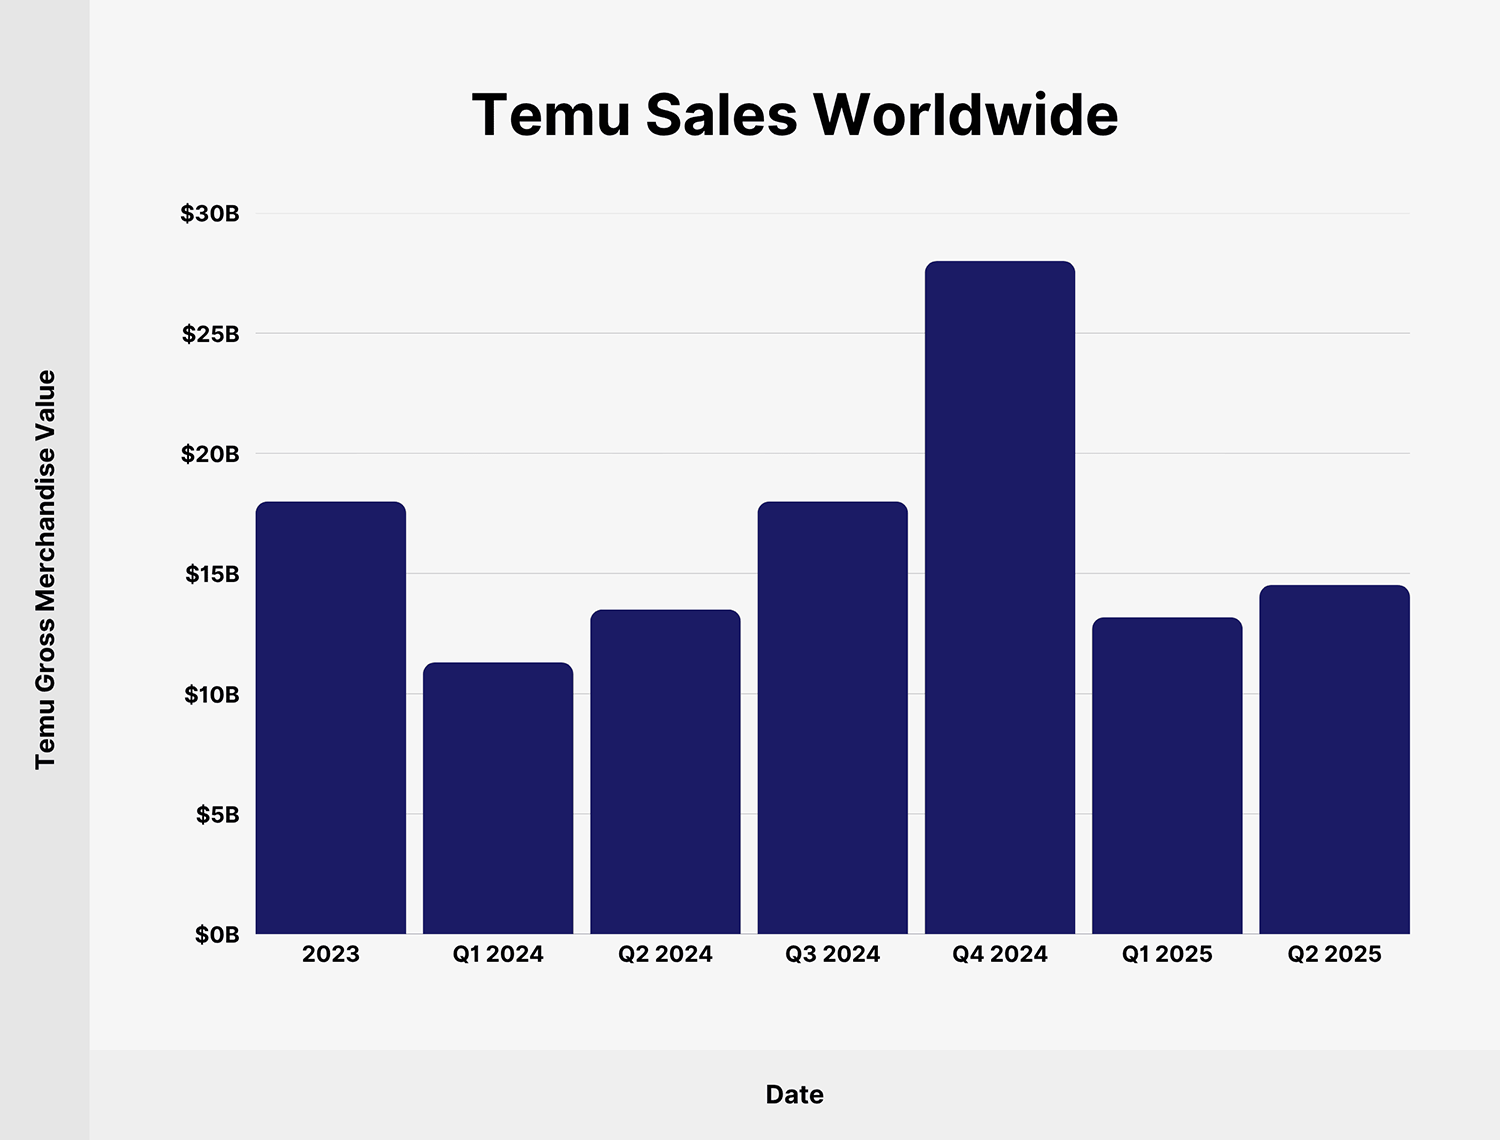
Here’s a detailed breakdown of Temu retail sales since 2023:
| Date | Temu Gross Merchandise Value |
|---|---|
| 2023 | $18 billion |
| Q1 2024 | $11.3 billion |
| Q2 2024 | $13.5 billion |
| Q3 2024 | $18 billion |
| Q4 2024 | $28 billion |
| Q1 2025 | $13.18 billion |
| Q2 2025 | $14.52 billion |
Source: Tech Buzz China, PDD Holdings
Temu order volume worldwide
According to recent data, consumers placed a total of 412.3 million orders on Temu in 2023.
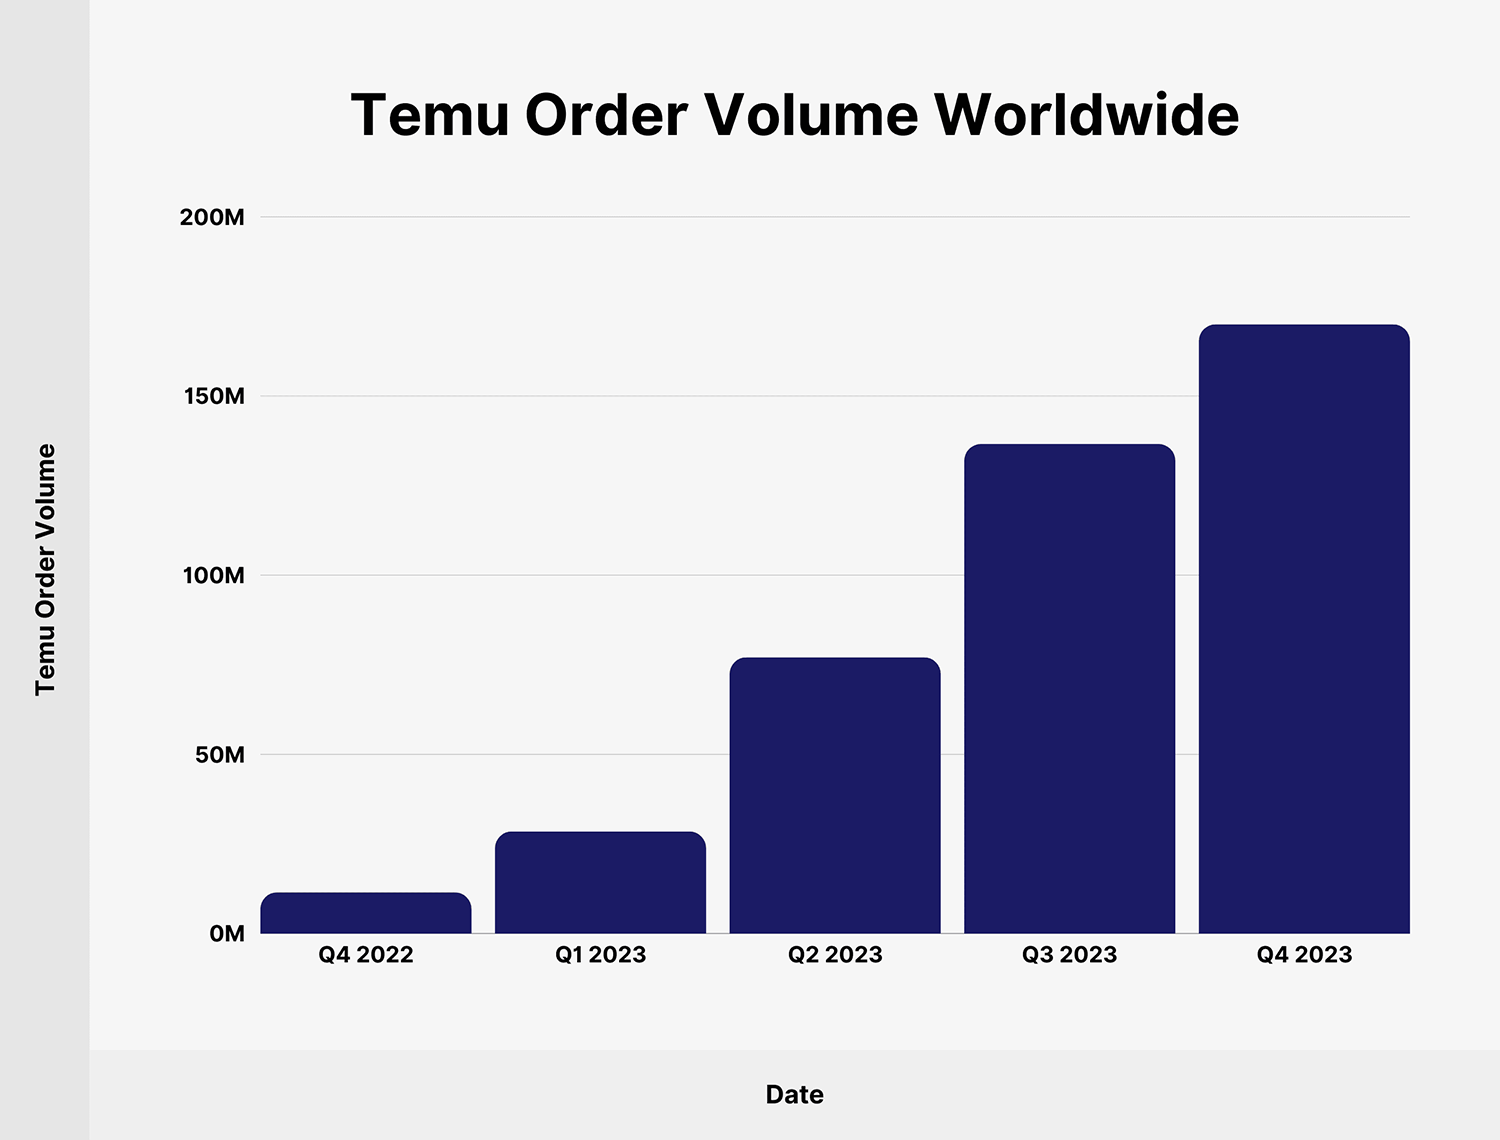
In Q4 2023 alone, the number of orders on Temu reached 170 million, a 14.8x increase compared to 11.5 million in Q4 2022.
Here’s a table with the number of orders on Temu since Q4 2022:
| Date | Temu Order Volume |
|---|---|
| Q4 2022 | 11.5 million |
| Q1 2023 | 28.5 million |
| Q2 2023 | 77.1 million |
| Q3 2023 | 136.6 million |
| Q4 2023 | 170.0 million |
Source: AllianceBernstein
Temu average order value
Average order value on Temu reached $38.9 in Q4 2023, representing a 62.08% year-over-year increase.
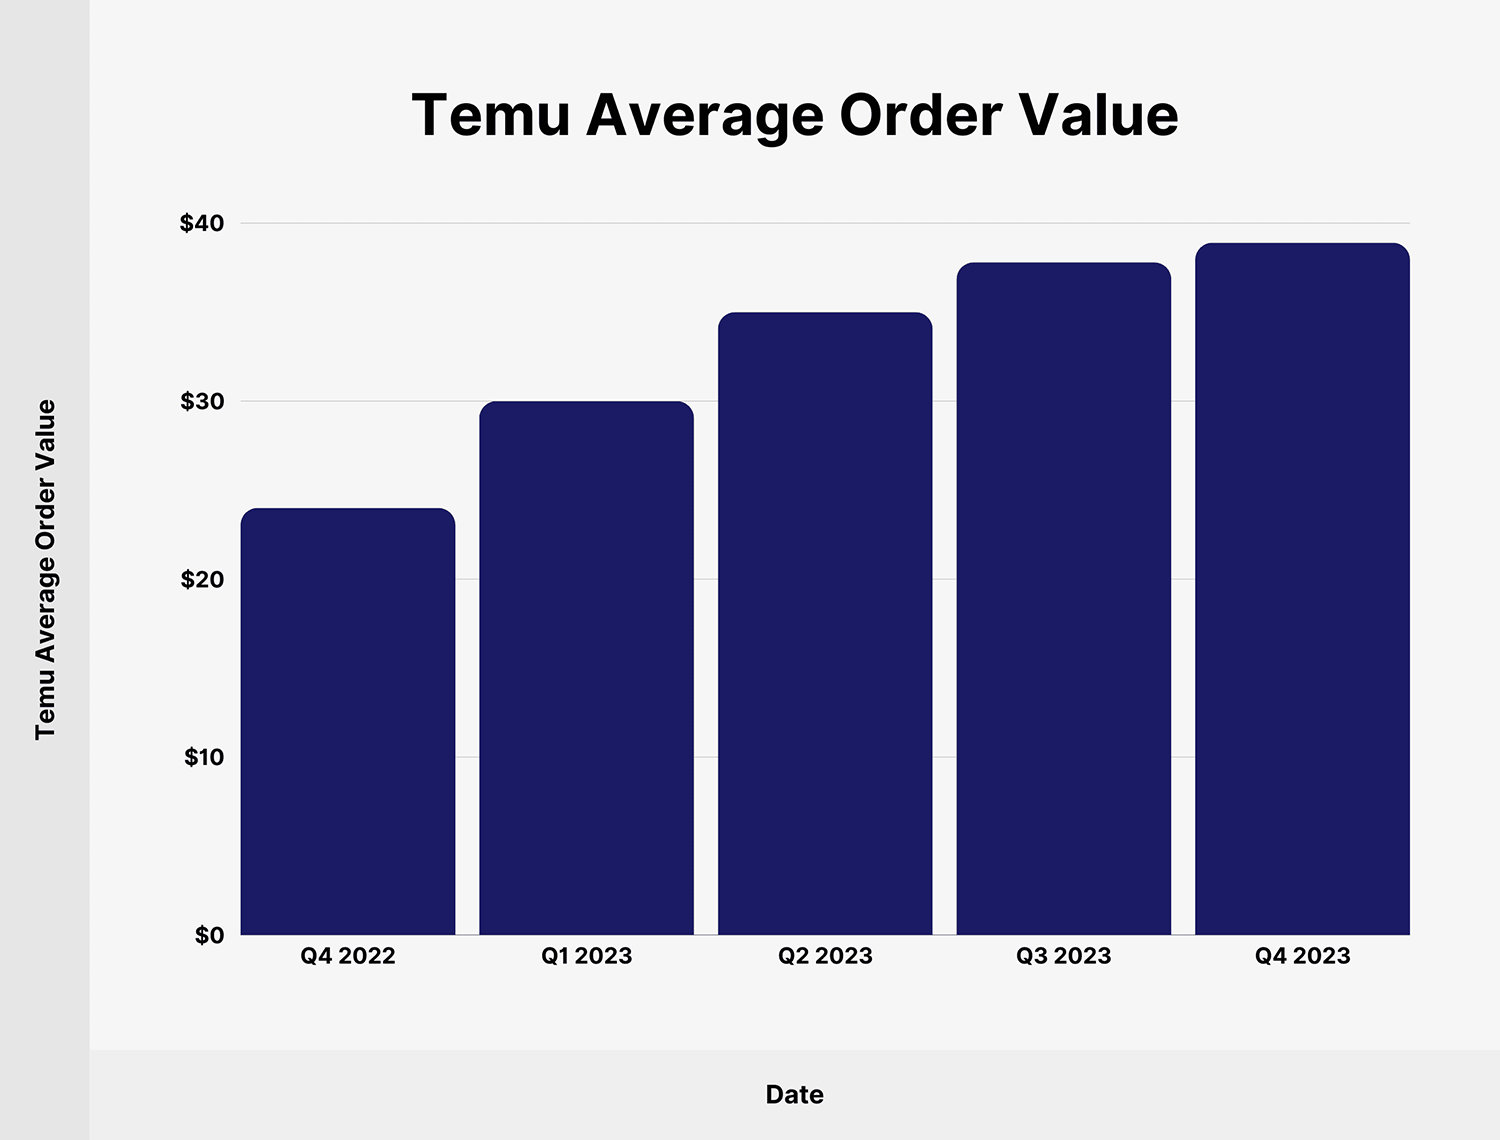
Here’s a table with the average order value since Q4 2022:
| Date | Temu Average Order Value |
|---|---|
| Q4 2022 | $24.0 |
| Q1 2023 | $30.0 |
| Q2 2023 | $35.0 |
| Q3 2023 | $37.8 |
| Q4 2023 | $38.9 |
Source: AllianceBernstein
Temu monthly visits worldwide
In September 2025, the number of monthly visits to the Temu website reached 1.8 billion. That’s up from 1.23 billion monthly visits in September 2024.
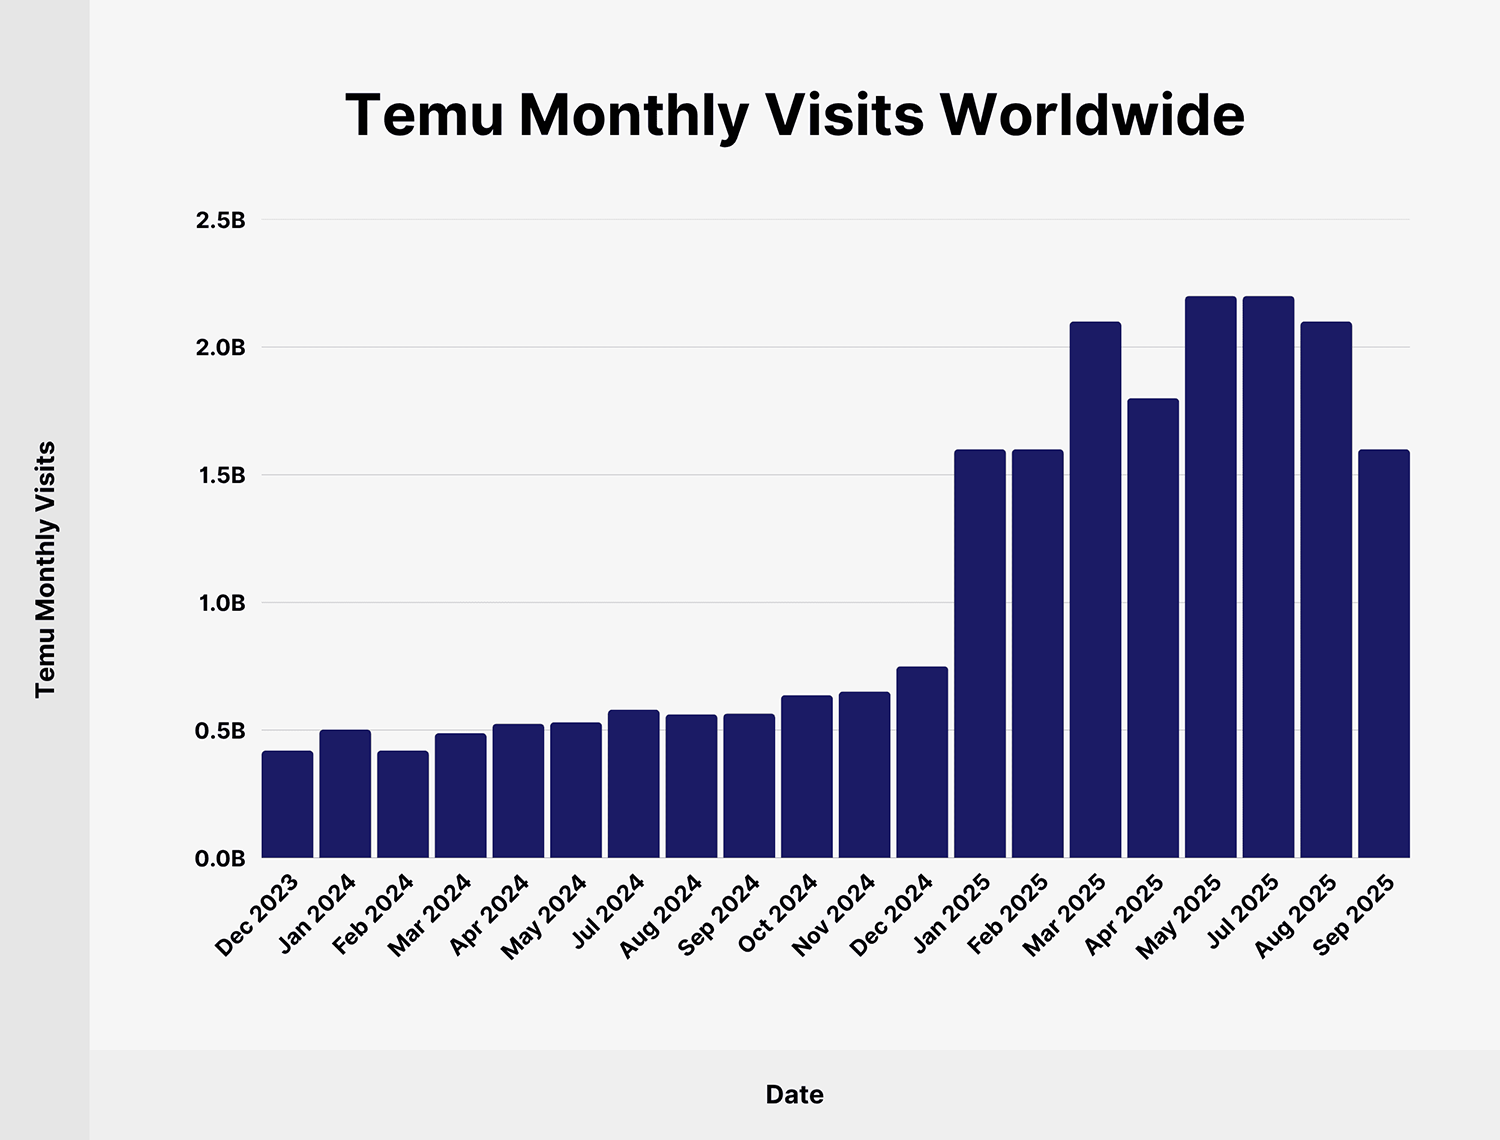
Here’s a detailed breakdown of desktop and mobile visits to the Temu website since December 2023:
| Date | Temu Monthly Visits |
|---|---|
| December 2023 | 420.99 million |
| January 2024 | 502.47 million |
| February 2024 | 420.69 million |
| March 2024 | 488.2 million |
| April 2024 | 525.26 million |
| May 2024 | 531.16 million |
| July 2024 | 579.66 million |
| August 2024 | 562.63 million |
| September 2024 | 565.2 million |
| October 2024 | 637.73 million |
| November 2024 | 651.08 million |
| December 2024 | 750.9 million |
| January 2025 | 1.6 billion |
| February 2025 | 1.6 billion |
| March 2025 | 2.1 billion |
| April 2025 | 1.8 billion |
| May 2025 | 2.2 billion |
| June 2025 | 2.2 billion |
| July 2025 | 2.3 billion |
| August 2025 | 2.1 billion |
| September 2025 | 1.8 billion |
Source: Semrush
Temu brand awareness in the US
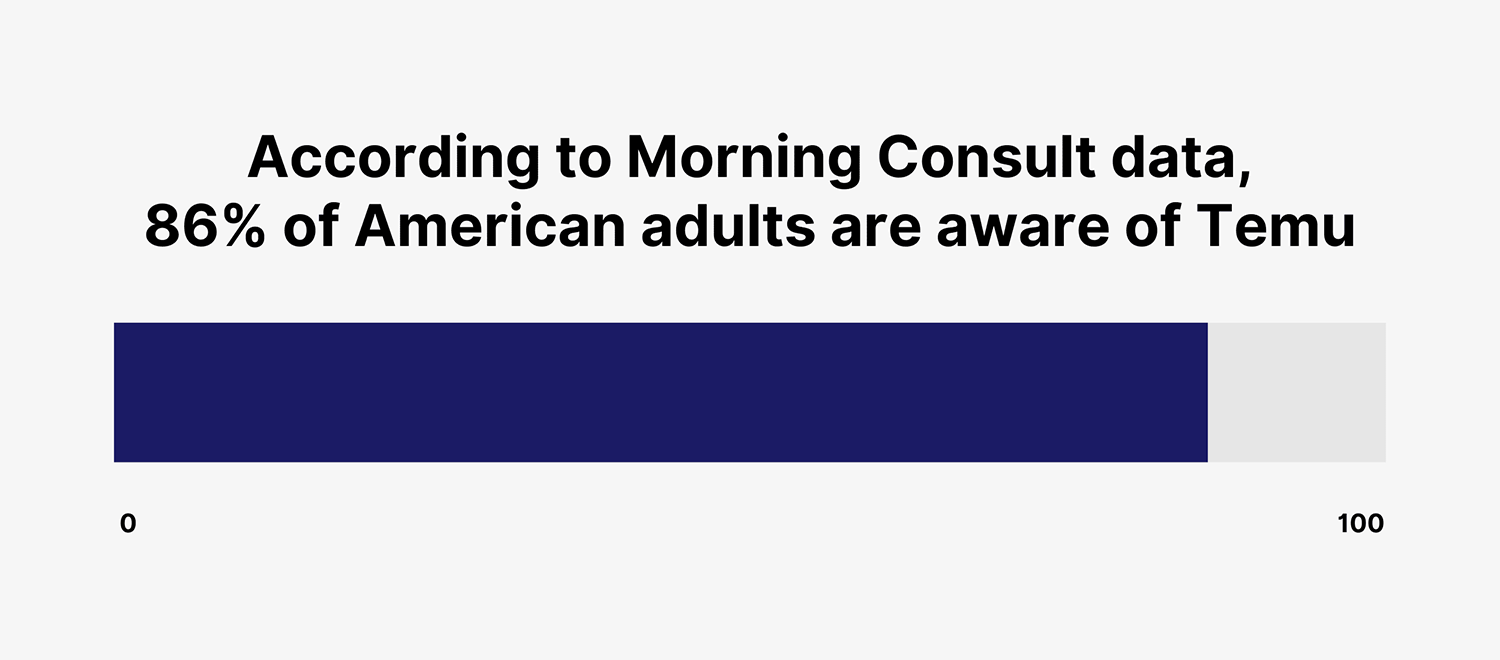
According to Morning Consult data, 86% of American adults are aware of Temu in 2025. That’s up from 75% in September 2023.
4 in 10 US adults claim to have made a purchase on Temu.
Source: Morning Consult
Temu adoption rate
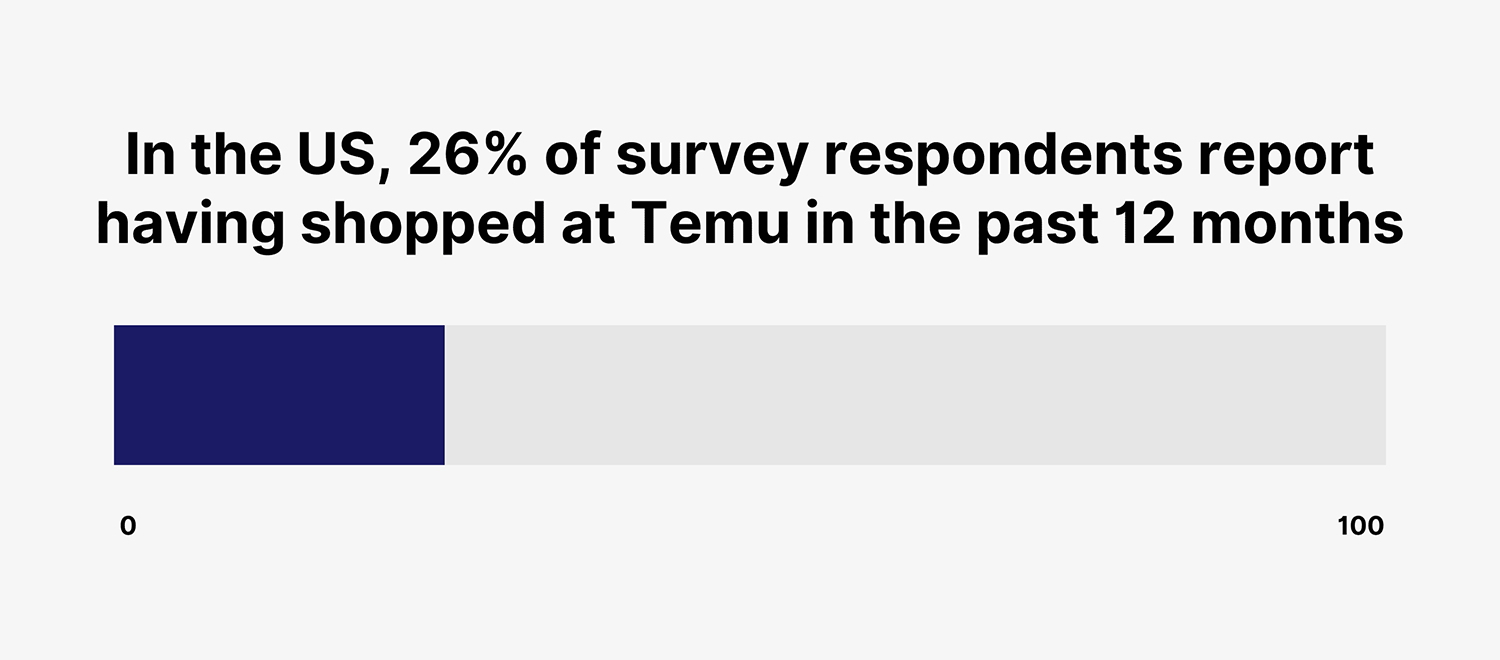
In the US, 26% of survey respondents report having shopped at Temu in the past 12 months. That’s similar to H&M (26%) and Shein (24%) adoption rate.
In the UK, 12% of consumers claim to have made a purchase at Temu in the last 12 months.
Among UK and US shoppers, Temu is most popular among millennials (ages 25-42) with a 21% adoption rate, followed by Gen X (43-55) with a 20% rate.
| Generation | Share of US and UK Consumers Who Shopped at Temu |
|---|---|
| Gen Z (18-24) | 14% |
| Millennials (25-42) | 21% |
| Gen X (43-55) | 20% |
| Boomers (56+) | 17% |
Source: Business of Fashion
Temu market share in the US
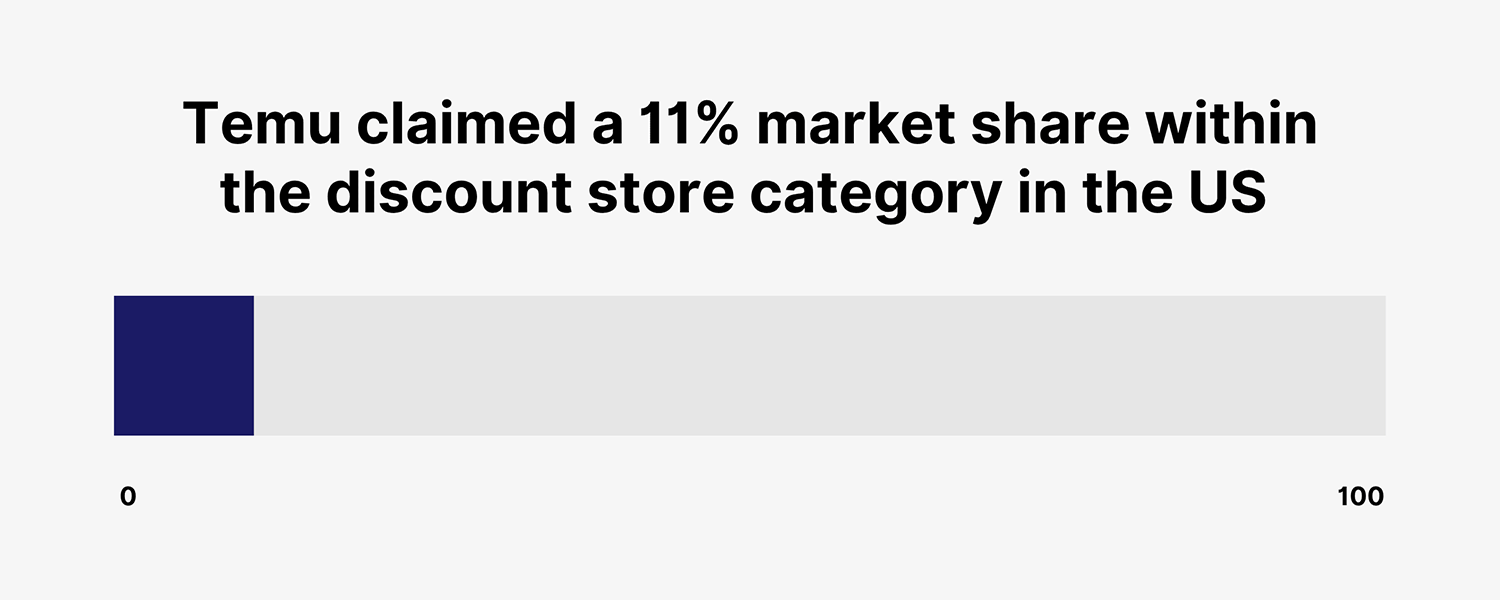
Temu currently claims an 11% market share within the discount store category in the US in 2025, behind Dollar General (43%) and Dollar Tree (28%).
Source: Business of Fashion, Investing
Temu customers overlap with other retailers
According to Earnest Analytics data, more than 8 in 10 US Temu customers shop at Walmart, Amazon, and Target.
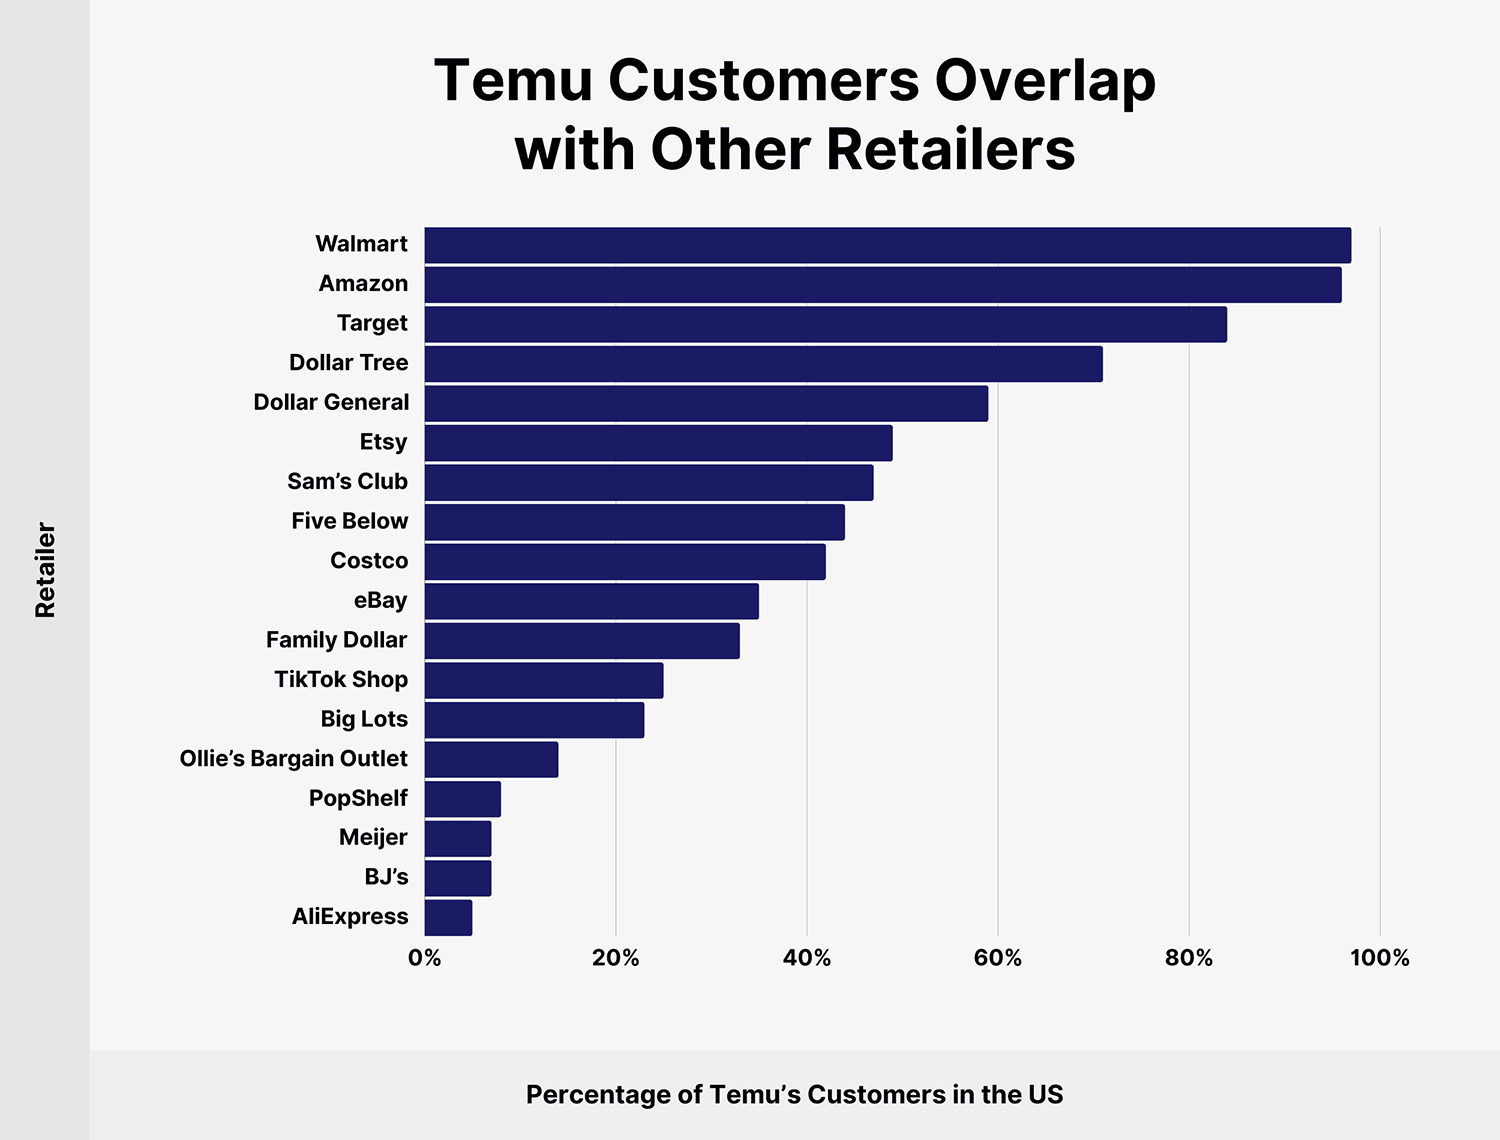
Here’s a detailed breakdown of Temu customers overlap in the US with other retailers:
| Retailer | Percentage of Temu’s Customers in the US |
|---|---|
| Walmart | 97% |
| Amazon | 96% |
| Target | 84% |
| Dollar Tree | 71% |
| Dollar General | 59% |
| Etsy | 49% |
| Sam’s Club | 47% |
| Five Below | 44% |
| Costco | 42% |
| eBay | 35% |
| Family Dollar | 33% |
| TikTok Shop | 25% |
| Big Lots | 23% |
| Ollie’s Bargain Outlet | 14% |
| PopShelf | 8% |
| Meijer | 7% |
| BJ’s | 7% |
| AliExpress | 5% |
Source: Earnest Analytics
What the Temu numbers show
Temu is a serious contender for the discount basket and an unproven one for everything else. For retailers, the useful response is not panic about scale but attention to the two things Temu does well: surfacing products people did not know they wanted, and making them easy to find.
Read next:
- How to build an ecommerce product discovery engine: a repeatable process for spotting trending products early, using growth classifications, TikTok signals and Amazon marketplace data, then checking margin, sourcing and saturation before you commit.
- 10 advanced ecommerce SEO tips that boost rankings and revenue: tactics past the fundamentals, including mining reviews and internal site search for the language customers actually use, indexing filters selectively, and keeping product data aligned across PDPs, schema and feeds.
Explore more on
Editorial disclosure
Search Engine Land is owned by Semrush. We remain committed to providing high-quality coverage of marketing topics. Unless otherwise noted, this page’s content was written by either an employee or a paid contractor of Semrush Inc.
About the author