4 Reasons Your Boss Might Hate Your SEM Campaign
An Enterprise Paid Search program can be, and should be, a sophisticated operation. Sophistication drives performance, but can often lead to challenges with perceived performance within the organization. It is not at all uncommon for senior management to become unhappy with a terrific and progressing paid search program because of the way we communicate results. […]
An Enterprise Paid Search program can be, and should be, a sophisticated operation. Sophistication drives performance, but can often lead to challenges with perceived performance within the organization.
It is not at all uncommon for senior management to become unhappy with a terrific and progressing paid search program because of the way we communicate results.
Averages and aggregates lie, as I’ve argued many times, yet they are also an essential tool of managing a paid search program. Even the manager in the weeds cannot look at the most granular performance data and make any sense of it.
We have to look at data aggregated over time, by category, by subcategory, by match type, by geography, manufacturer, the list goes on and on. To really understand what’s going on, we have to study the data six ways to Sunday to get the complete picture, but that can create problems for reporting out results to senior management.
Management doesn’t have time to study the details and aggregated reports can make great performance look mediocre or worse.
Four Reasons Management Can Be Unhappy With A Great Program
1. Judging the program by metrics outside of the paid search manager’s control.
The most prevalent example comes from blending brand/navigational search in with competitive non-brand search. Since brand search is almost entirely driven by other marketing efforts, the search manager should neither receive credit nor blame for those numbers. I detailed this one a couple months ago, so I’ll leave it at that.
2. Management sets goals that aren’t grounded in reality.
Any good SEM firm can point to plenty of examples of putting up gaudy growth numbers when taking over poorly managed programs. But there are also instances when new senior managers come in with “ambitious” goals for a program that is already hitting on all cylinders.
“We’re planning on 100% YOY growth this year, so you’re going to have to work really hard!” Failure to understand market constraints can make excellent performance look “way below our targets.”
3. Looking at the wrong numbers on the report.
Less common now than in the past, but still not uncommon: people who don’t get search will often latch onto metrics that are indicative of nothing. For example:
- What’s happened to our CTR?!?
- Why is the conversion rate down?
- Our average CPC has gone up! That’s terrible! What’s going on!
- Our average position dropped, someone’s head must roll!
- How many keywords have you added this week? Get cracking!
All of these can be useful diagnostic markers for identifying potential problems and opportunities, but many folks still mistake these for KPIs. They aren’t, and certainly aren’t for management level. A paid search manager might add a bunch of ads that perform differently in the marketplace than others and still be a tremendously helpful addition.
Consider the following example, where the non-brand search results typically look like this in aggregate:
![]()
The intrepid search analyst finds a treasure trove of great new keywords and launches them, producing the following results:

Uninformed upper management goes nuts:
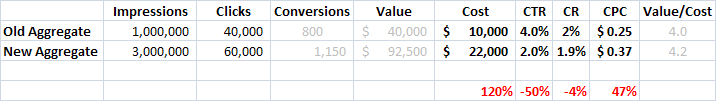
“Haaaaaaaaaaarumph! Click-through rate is down 50%! Conversion rates have dropped 4%! CPCs are up nearly 50%! Heads must roll!”
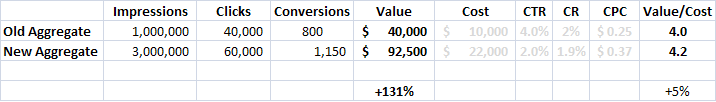
Focusing on the more meaningful available metrics would yield a different response. “Wow! Sales are up over 130% and the ROI actually improved! That’s fantastic!”
4. Effectively hiding the most meaningful numbers from management.
This manifests itself in many different ways. Let’s consider the case of a major auto insurance company. They take leads in exchange for rate quotes. The average lead is worth $250 to them.
The outstanding search marketing manager conducts research on the back end performance of leads and learns that the leads from certain types of keywords (or geographies or whatever) are significantly more valuable than others (say $500), and that leads generated from searches for “cheap/discount/low-budget insurance” are worth considerably less (say $150).
Looking at the past data this way reveals that they’ve been overspending in some areas and underspending in others. So, she adjusts the targets to generate better ROI for the company.

But senior management wants her fired because from their vantage point, the numbers went south big time.
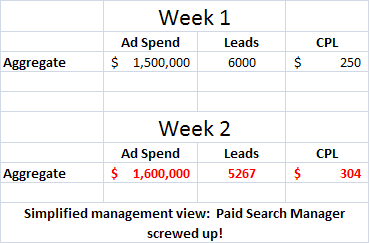
“Spend is up, leads are down, and the CPL is way out of line with our target!”
Understanding the actual lead values, it’s clear that in fact the search marketer has made the right moves for the company, but if management doesn’t see those numbers…
This phenomena can take many different shapes and forms. In ecommerce, different product lines have different margin structures making a $100 purchase in a high margin category much more valuable to the firm than a $100 purchase in a low margin category.
If the actual margin data can’t be fed into the system dynamically setting different efficiency targets by categories is the next best solution, but that leads to difficulty interpreting the numbers when aggregated across categories.
In this example, the first week’s data reveals fine results, in line with efficiency metrics necessary to maximize operating margin from each category.
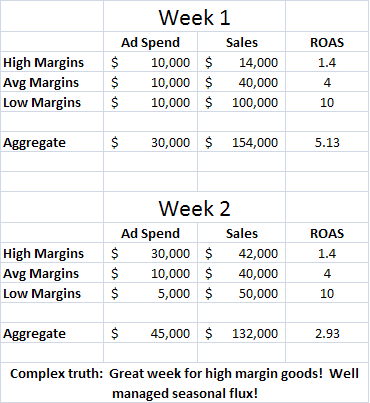
The next week sees a seasonal spike in interest in the high margin products and a decline in interest in the low margin items. The well managed program hits the category efficiency metrics again, maximizing operating margin for the company, but the aggregate results showing only costs and sales seems to indicate a decline.
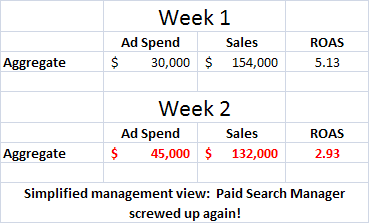
It’s important to note here that from the aggregate numbers there is no way to tell whether the program has gone downhill or continues to perform well. The same aggregate numbers could in fact reflect poor management and missed opportunities.
This is not the fault of upper management’s misunderstanding as much as the difficulty inherent in communicating the complex truth, which is particularly challenging when we can’t present the numbers to which we’re actually driving (net margin in this case). Many companies can feed margin data into a good bid management platform either at check out or in a back feed, but some companies simply can’t tie that thread.
As programs become more sophisticated — incorporating lifetime value considerations, what keywords generate more new customers than old, more business customers than consumers, etc. — the communication and evaluation metrics become that much more challenging to convey
Working Towards A Better Solution
There is no perfect solution here, but there are a few approaches that can help:
- Getting everyone in senior management to have a basic understanding of what the channel can and cannot do, what controls we have available, what the goals of the program are, and the challenges of viewing aggregated data is a great start. The more those folks understand about how search works the more they’ll appreciate the good work you do. Keeping management ignorant can help the incompetent manager, but creates jeopardy for the supremely competent.
- Sharing more detailed reports to management that better reflect all the nuances. This is a great solution if the management team will go along with and actually review more complex reports. The challenge is many managers operate under the dashboard principle: “I just want to see either green numbers or red numbers. Don’t tell me it’s more complicated than that!”
- Determining and reporting out an “all-in value” metric that is consistent with the program’s management goals. If the goal of the program is to drive gross margin dollars, then the aggregated reports should show gross margin dollars, not just sales. If the actual dollars can’t be determined establishing a best proxy can make sense. If experience and research suggests that the advertiser gets different types of leads which have inherently different value,
For example: homeowner’s insurance vs car insurance vs personal property insurance vs motorcycle insurance, and that within those leads of differing value there are classes of keywords within each product that drive leads of different value (homeowners insurance from Beverly Hills vs Tumbleweed, Texas), then assigning and reporting out some approximate dollar value tied to each lead collected will give a much truer picture of the health of the program week-to-week than will aggregate lead counts that treat them all equally.
This notion can be extended, to include a dollar value associated with new customers vs existing, different customer types, non-conversion success metrics like email sign-ups, etc. Assigning assumed $ values does carry the potential pitfall that the folks in accounting look at the report and flip-out because the dollars reported aren’t “real” in their minds.
We shouldn’t avoid complexities because of the communication challenges they present. Raising the bar demands a nuanced approach, and it is incumbent on both the paid search managers and senior management to make sure the lines of communication and the reward structures are aligned to encourage raising the bar, not lowering it.
Contributing authors are invited to create content for Search Engine Land and are chosen for their expertise and contribution to the search community. Our contributors work under the oversight of the editorial staff and contributions are checked for quality and relevance to our readers. The opinions they express are their own.
Related stories
New on Search Engine Land
About the author