A Good Start For Paid Search In 2013
It’s April, which means that spring is here and the first quarter of 2013 is in the books! The birds are chirping, the flowers are blooming, and the ads are clicking. Aren’t the landing pages pretty at this time of year? At Kenshoo, we sit on some massive data sets that we share each quarter […]
It’s April, which means that spring is here and the first quarter of 2013 is in the books! The birds are chirping, the flowers are blooming, and the ads are clicking.
Aren’t the landing pages pretty at this time of year?
At Kenshoo, we sit on some massive data sets that we share each quarter in our Global Search Advertising Trends reports. You can download the full Q1 2013 report here; but, let’s dive in and look at some of the highlights.
Note: In the report, you can read about our methodology to see how we arrived at these numbers, so I won’t go into that here. Just know that our goal is to use as much of the full data set as possible from our 1.2+ million active paid search campaigns from clients in more than 190 countries while making sure anomalies (such as recent advertisers moving onto our platform) don’t skew the results.
Q1 Quarter-Over-Quarter & Year-Over-Year Spend
When it comes to paid search, 2012 was a strong year, as total spend grew 32% from 2011. Thus, the fact that Q1 2013 was up 15% YoY from Q1 2012 seems to suggest that we’re off to a good start. The data in this report go back five quarters, and search has been trending upward for the entire range.
Of course, Q1 was down QoQ (16%) from Q4 2012; but, this is unlikely to be a cause for concern as Q4 is always a popular option for marketers looking to capitalize on the holiday shopping season. In fact, 2012 Q1 was down QoQ from 2011 Q4 at a very similar rate of 14% — and subsequently, 2012 turned out to be a healthy year for SEM.
Clicks, Impressions, CTR & CPCs
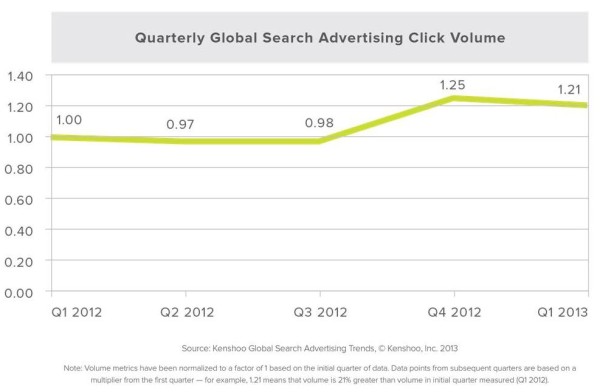
Spend was up and so was total click volume. In the Kenshoo Index charts, such as the one below, we normalize the data to a factor of 1 from the first quarter to make tracking the trend much clearer. The click volume index of Q1 2013 was 1.21, which means it was 21% higher than the data set’s initial quarter (Q1 2012).
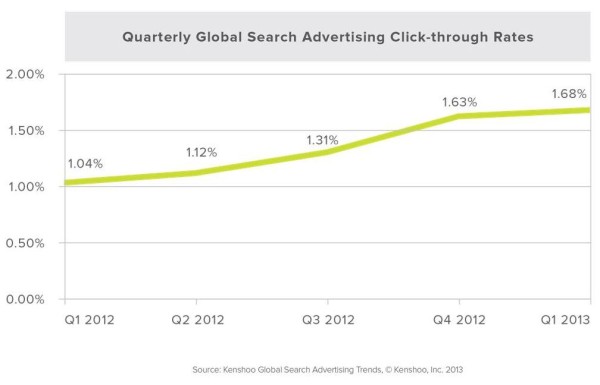
The global cost-per-click was similar YoY at $0.39 globally last quarter versus $0.41 in Q1 of 2012. However, what was very interesting to see was that global click-through-rate (CTR) improved a full 62% YoY from 1.04% last year for the same quarter to 1.68% in Q1 of this year.
The effect of CTR increasing was that even though spend was up 15% YoY, total paid search impressions were down 26% YoY. In fact, as you can see below, when both the CTR and the impression volume charts are side by side, these two metrics are inversely correlated — as CTR goes up, impression volume declines.
This should not surprise any search marketers who understand that high CTR means you will need fewer impressions to reach your click and spend goals. As well, because CTR is an important driver to AdWords Quality Score, optimizing for CTR has other positive, systemic effects.

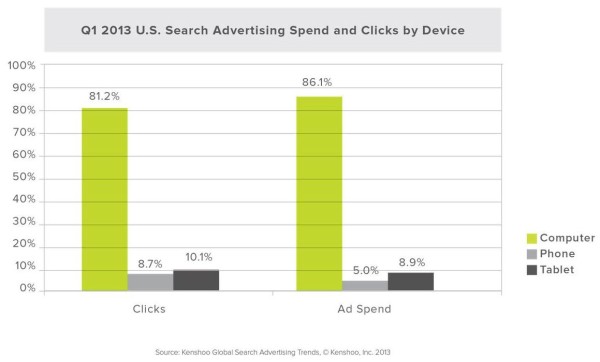
Breakdown By Device In The U.S.
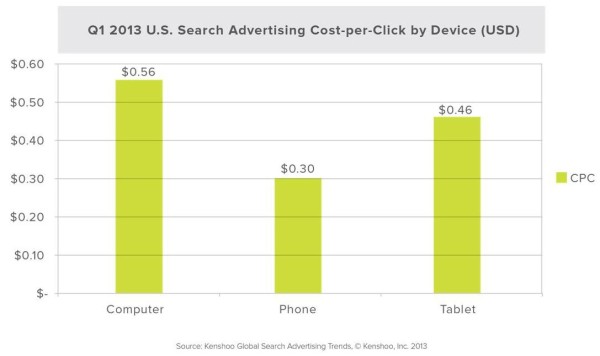
In the U.S., mobile devices represented 19% of total clicks for Q1 2013. Budgets for mobile devices were only 14% of total spend; but, when you note that CPCs averaged lower than the computer average of $0.56 ($0.30 for phones, $0.46 for tablets), it appears that the click-to-spend ratio is fairly close.
One note here is that tablet CPCs are more than one and a half times the cost of mobile CPCs; clicks and spend were higher on tablets than phones, as well.
In Summary
What does the Q1 data mean for paid search? Well, from a top-level perspective, I think that most paid search pros would conclude that these are strong Key Performance Indicators that point to a healthy SEM ecosystem.
Spend and clicks are up, so it appears that search engines are still providing efficient and worthwhile advertising opportunities. CPCs are slightly down, which means marketers are getting more clicks for their budgets; and CTR is up, which may mean that consumers are finding more relevance in paid search ads.
Paid search marketers are also paying attention to mobile devices and separating their phone strategy from their tablet strategy. When it comes to tablets, in Q1 2013, marketers bought more clicks, spent more dollars, and were willing to pay more per click than their smaller-screen counterparts.
In the full report, we break down some of these numbers by region — you’ll see that U.K. CPCs on tablet devices are on par with computer CPCs for the first time.
Good work, Q1! I’ll report back after Q2, and we’ll see if these positive trends continue. Meanwhile, let’s get ready to spring ahead!
Contributing authors are invited to create content for Search Engine Land and are chosen for their expertise and contribution to the search community. Our contributors work under the oversight of the editorial staff and contributions are checked for quality and relevance to our readers. The opinions they express are their own.
Related stories
About the author