Ad Testing: Are You Using The Wrong Success Metrics?
Everyone knows you should test ads – that’s not debatable anymore. However, what is debatable is which of the ads you are testing is actually the best ad. I recently polled a large group of marketers and asked them of these ads, which one performed the best: Take a moment to decide which you think […]
 Everyone knows you should test ads – that’s not debatable anymore. However, what is debatable is which of the ads you are testing is actually the best ad.
I recently polled a large group of marketers and asked them of these ads, which one performed the best:
Take a moment to decide which you think is the winner.
Here were the responses:

Just 7.3% thought there wasn’t enough data to determine a winner. Those are the ones who are correct.
The Current Metrics Are Flawed
When you consider all the stats needed to determine a winner; you need to work from these numbers:
- Impressions
- Clicks
- CPC
- Cost
- CTR
- Conversions
- Average sale amount
From those metrics, the most commonly generated stats to determine a winner are:
- Conversion rate
- CPA (cost per acquisition)
- ROAS / ROI
- CPI (conversion per impression)
Each one of those metrics has a fundamental flaw.
- Conversion rate does not take into account impressions, click through rate, or average sale amount.
- Cost per acquisition does not take into account volume (impressions and clicks) or average sale amount.
- ROI / ROAS does not account for volume (impressions and clicks).
- Conversion per impression does not take into account average sale amount.
It Starts At The Impression
Assuming your campaign is targeted towards sales (we’re going to leave the branding discussion for another day); you should be measuring from the impression.
You choose a keyword. Someone searched for your keyword. That combination creates an opportunity for your ad to be displayed. It also creates an opportunity for a conversion.
Yes, every single impression has an opportunity to generate a sale. Therefore, your measurements should start at the impression as well.
Clicks Through Rate vs. Conversion Rate
One of the problems with testing is that you have two big metrics you’re often examining: CTR and conversion rates.
However, which of the scenarios below is better?
- High CTR, low conversion rate
- Low conversion rate, high CTR
- Mid range CTR, mid range conversion rate
It’s an impossible scenario to measure unless you are using a metric that incorporates CTR, costs, conversions, and average sale amounts into a single number. That’s what Profit per Impression will do.
Profit Per Impression
I first started using this metric in 2002 and first started writing publicly about it in 2006. I’m still amazed at how little adoption this metric has since it is the overall best metric to use for testing and its very easy to calculate.
To calculate this metric, all you need to do is take the original stats from above and add a few pieces of data:
- Revenue (this might take some effort if you are doing ecommerce with variable sales amounts and product costs, but it is worth the effort)
- Profits (simple: Revenue – cost. I’m ignoring the complex aspects here of adding lighting, salaries, etc)
With those metrics, calculating PPI (profit per impression) is easy; just divide profit by impression:
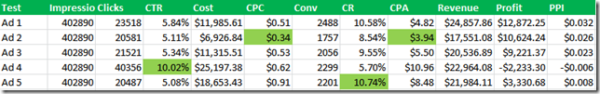
It turns out the ‘best’ ad is not the one with the lowest CPA, the highest CTR, or the highest conversion rate.
It turns out that 4.2% of the original voters were correct (or 11.7% if you count those who voted that there wasn’t enough data); but since they didn’t have the correct data it was most likely due to a good guess.
The one issue with taking stats from Google ad tests is that Google does not rotate ads evenly; but there are some rotate fixes available). To prove the PPI theory, let’s see the extrapolated stats as if every ad actually received the same number of impressions:

As you can clearly see, ad 1 is a clear winner in terms of total profit.
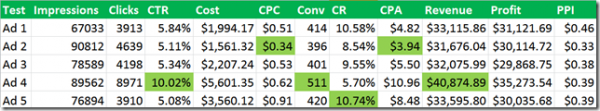
If you happen to be wondering why these stats seem so high on the revenue basis; its because the revenue is not based upon a one time sale. It’s the lifetime value of the customer. Always take into account lifetime values. Here are the stats if you base the numbers off of just first month revenue:
While ad 1 is still the clear winner; from a single month basis the highest CTR ad is actually losing money and doesn’t appear to be profitable.
To get a clear picture of your actual revenues, if customers buy from you more than once a year, which includes subscription products, then you need to calculate PPI from the entire customer’s revenue and not just the first time sale.
The Quality Score Wrinkle
There are some times when I won’t actually pick the best PPI ad; and that is often due to Quality Score. If the second best PPI ad has a much higher CTR than the best PPI ad, then I will often pick the 2nd best.
Because CTR is such a huge quality score factor, if you pick an ad with a much lower overall CTR, you could cause your Quality Score to drop which in turns means you average position will decrease or your average CPC will increase (or both).
If in this test, ad 4 (with a CTR almost double all the other ads) didn’t have a $0.39 Profit per Impression, but was instead in the $0.43-$0.45 range; then I would have declared it the winner instead due to the Quality Score wild card.
Alternatively, I would have set up an ACE (AdWords Campaign Experiments) test between the two ads to see if I could get some Quality Score insights between the two ad and keyword combinations. However, it was enough lower in total profits that its not the winner by a large margin; and therefore, I would pick ad 1 as my true winner.
Conclusion
Testing is easy. Pick at least one ad group and:
- Write a few ads
- Wait
- Measure the results
- Learn from the losers
- Delete the losers
- Write another ad or two
- Hit save
- Wait
- Measure
- Repeat
There’s nothing difficult about testing. However, if you are using the wrong success metrics in your test; then your time and efforts will be wasted. By using Profit Per Impression metrics, you can be assured that you are pick the ad in your tests that will bring you the most profit for your paid search account.
Contributing authors are invited to create content for Search Engine Land and are chosen for their expertise and contribution to the search community. Our contributors work under the oversight of the editorial staff and contributions are checked for quality and relevance to our readers. The opinions they express are their own.
Related stories
New on Search Engine Land
About the author